Section 3.1
Human Footprint Surrounding Wetland Health Monitoring Sites
We summarize the extent of different types of human footprint in catchments surrounding ABMI's open water wetland sites, including changes between 2010 and 2021.

 ABMI
ABMI
In 2021, agriculture accounted for more than 40% of disturbance around open water wetlands in the Grassland and Parkland natural regions.
- We summarized the average human footprint cover—overall and by specific categories including impervious surface area—in catchments surrounding shallow open water (SOW) wetland monitoring sites for 2010 and 2021.
- In 2021, human footprint around SOW wetlands was highest in the Parkland (71.1%) and Grassland (54.0%) natural regions, as was the area of impervious surface cover at 8.1% and 5.0%, respectively.
- Agriculture human footprint was the most common type in the Parkland (52.4%), Grassland (40.6%), and Boreal Forest (7.0%) natural regions, while forestry footprint was the most common type in the Foothills (13.0%) and Rocky Mountain (7.4%) natural regions.
- Between 2010 and 2021, the Foothills Natural Region experienced the largest increase in human footprint (+3.6 percentage points, from 16.6% to 20.2%), followed by the Boreal Forest Natural Region (+1.2 percentage points, from 12.9% to 14.1%).
- There is a need to assess levels of disturbance around wetland classes other than SOW (e.g., marshes, bogs, fens), as well as wetland loss.
Background
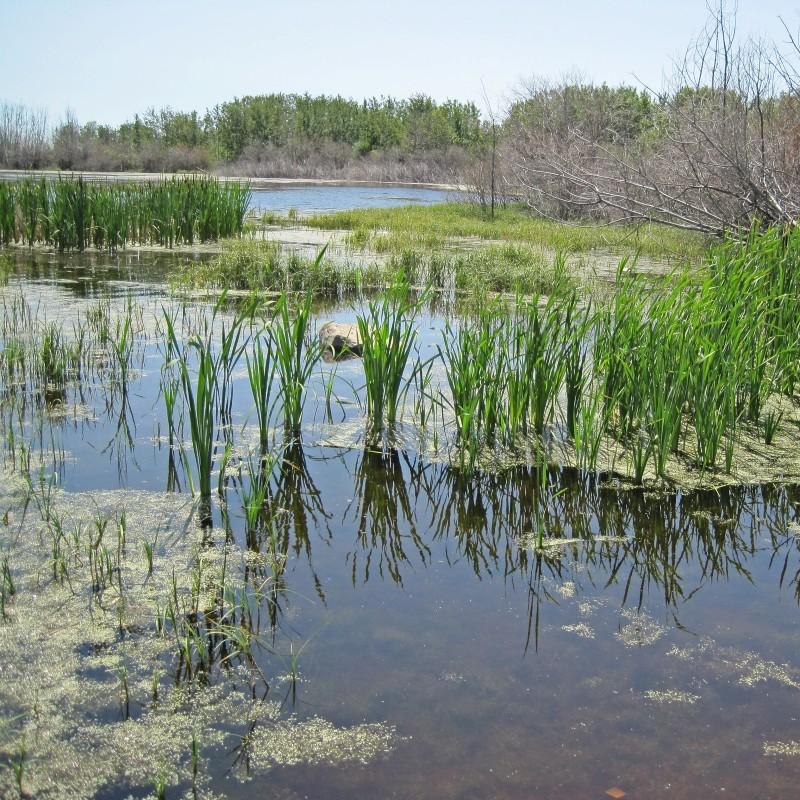
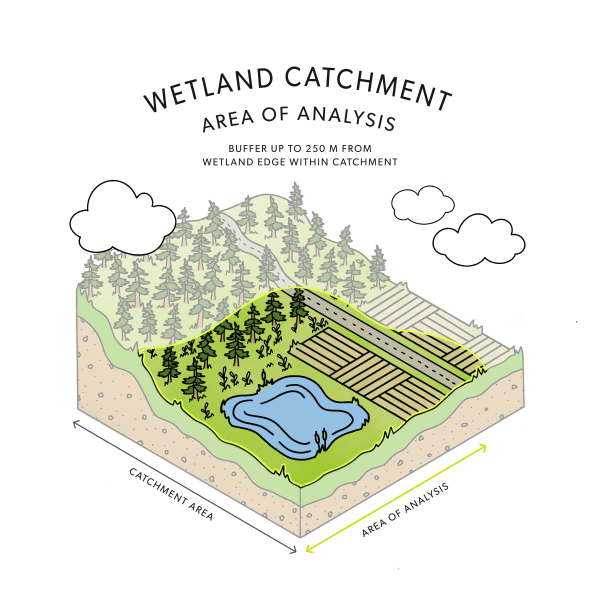
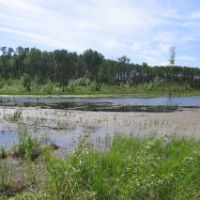
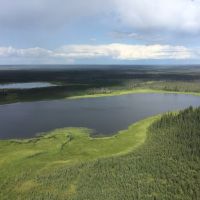
- Wetlands, typically situated at low points in the landscape, receive water from overland flow as rain or melting snow drains into them from the surrounding area, known as the wetland catchment.
- Human development in catchments can have several indirect effects on wetlands, including the transfer of pollutants, increased sedimentation and nutrient levels, and the introduction of invasive species.
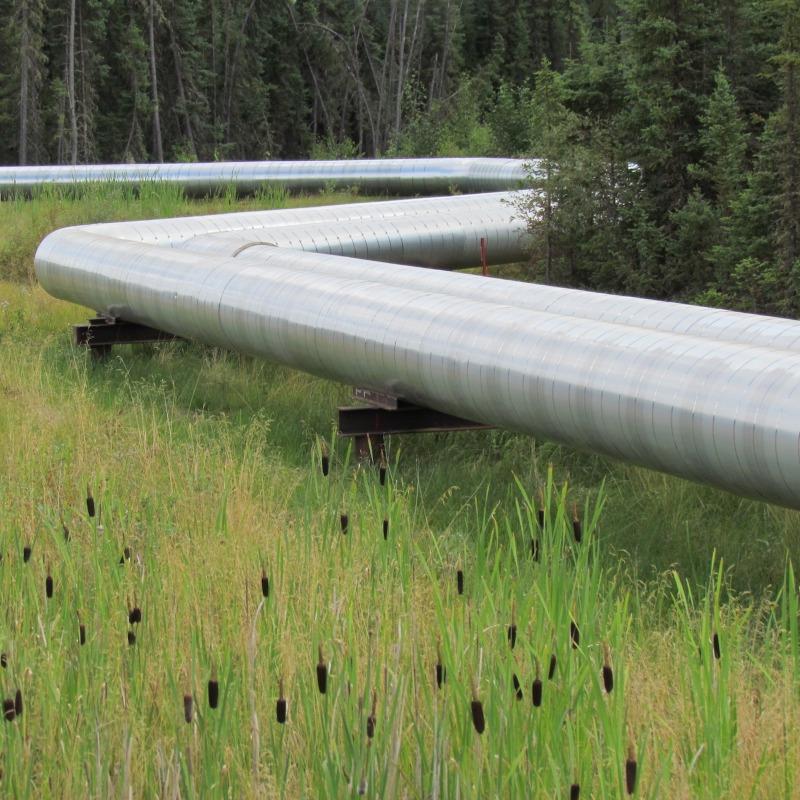
- Additionally, impervious surfaces—such as roads, parking lots, and buildings—prevent stormwater from seeping into the ground, altering natural water flow and drainage patterns within a catchment[1]. Key effects include increased surface runoff, which can lead to greater flooding and erosion, reduced groundwater recharge, and decreased water quality as pollutants from impervious surfaces are washed into the wetlands.
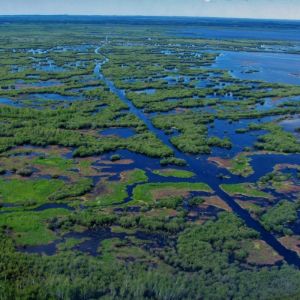
- Hydrologic connections between wetlands and surrounding areas also serve as conduits for movement, connecting wetland habitats and populations of native wetland plants and animals across the landscape. Human disturbances can disrupt these natural connections, leading to fragmentation of wetland habitats.
In this section we summarize the average human footprint cover—overall and by specific categories including impervious surface area—in catchments surrounding shallow open water (SOW) wetland monitoring sites for 2010 and 2021.
 ABMI
ABMI
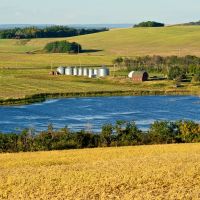
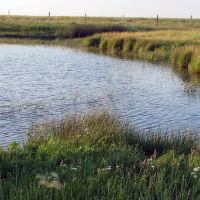
Agricultural runoff can affect water quality by introducing nutrients and sediment.
 Ramon Cliff
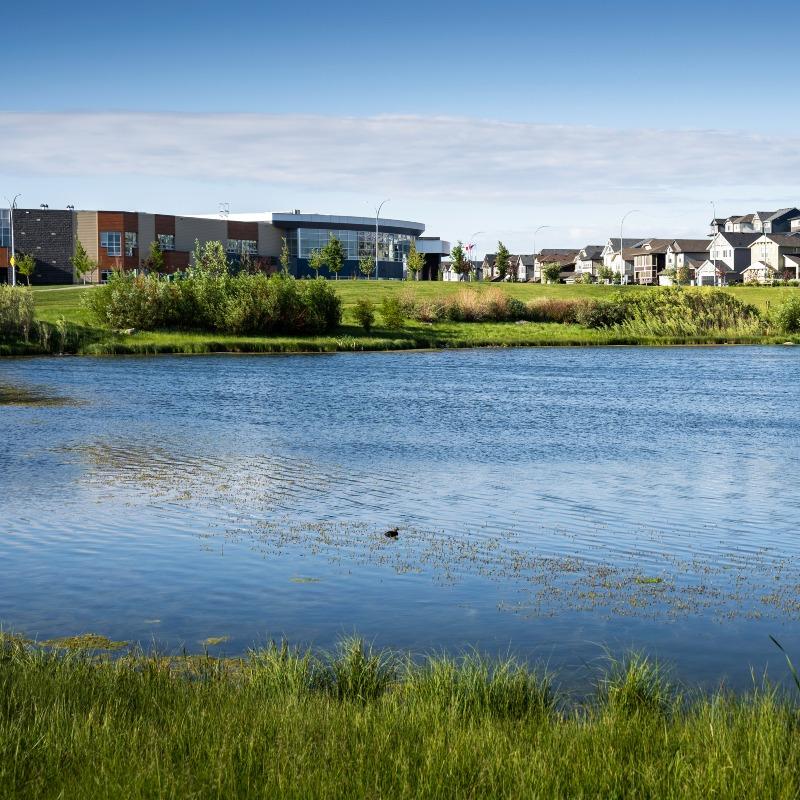
Wetlands in urban areas provide habitat to a wide range of species.
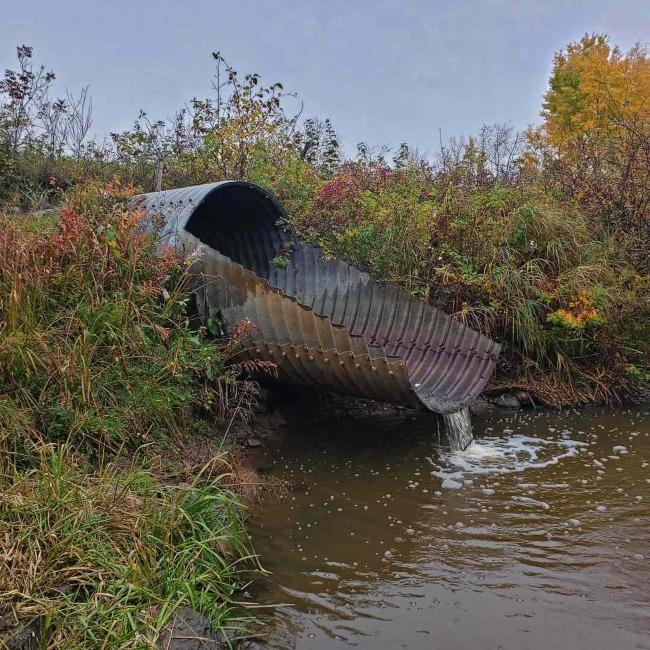
Hanging culverts under roads can interrupt the natural flow of water and organisms between wetlands.
The Alberta Wetland Policy provides direction to avoid or minimize impacts to wetlands.
Defining Catchments
Defining Catchments
- We calculated catchments surrounding our wetland monitoring sites and summarized the human footprint cover in them.
- We used a new method for delineating the topographic catchment area using GIS tools, including a digital elevation model, simulated flow direction, and the ArcGIS watershed tool.
- The topography-based catchments represent the gross drainage area or the area surrounding the wetland that could contribute water to the wetland through overland flow.
- The method combines the original 250-m buffer around the open water zone shape and the topographic catchment shape. We confirmed in the literature that 250 m is an appropriate size to quantify disturbance surrounding wetlands[2,3,4,5].
- The resulting catchment is any area that is included in both the 250-m buffer and the topography-based catchment.
Methods
Wetland Health Monitoring Sites
- ABMI's wetland health monitoring program targets permanent, shallow open water (SOW) wetlands as monitoring sites. These sites are part of the ABMI's systematic grid of 1,656 site locations, spaced 20 km apart across the province.
- There are 1,404 wetland monitoring sites included in this summary: 51 in the Rocky Mountain, 151 in the Foothills, 271 in the Grassland, 160 in the Parkland, 714 in the Boreal Forest, and 30 in the Canadian Shield natural regions.
Human Footprint Analysis
- We used the Human Footprint Inventory (HFI) 2021 to summarize percent area of human footprint for two periods, 2010 and 2021—broken down by natural region—within each catchment where our open water wetland monitoring sites are located.
- Human footprint is summarized by total area and is also broken into the following categories[6]: agriculture, forestry, transportation, energy, and urban/industrial.
Impervious Surface Calculation
- To calculate impervious surface area within each catchment, we estimated the total impervious surface by summing the impervious surface area of each human footprint within each catchment. The steps we completed were:
- Classified human footprint feature types based on published impervious surface estimates[7,8,9], which indicate the percent of the area within that feature type that prevents water infiltration. For example, harvest areas were estimated to be 13% impervious and paved roads were estimated to be 100% impervious.
- Multiplied the total area of each feature type by the impervious surface estimates to calculate a total impervious surface area for that feature.
- Summed the feature impervious surface estimates for the whole catchment.
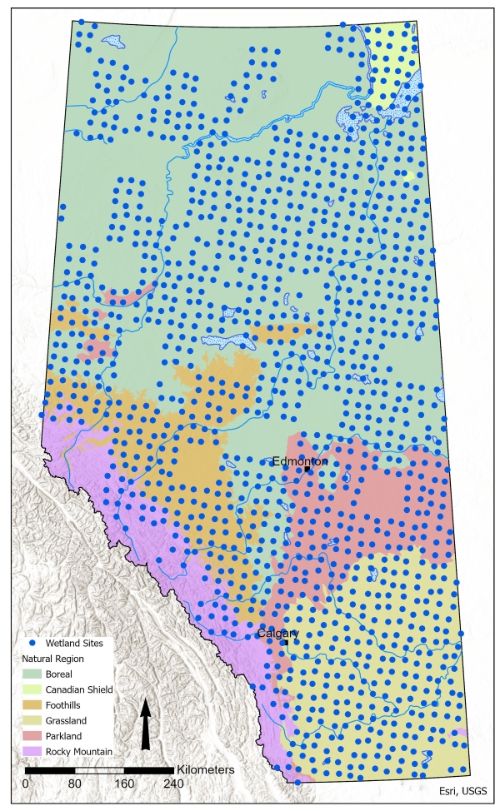
ABMI wetland health monitoring sites in Alberta. Note that the exact wetland site locations are not displayed—monitoring sites are randomly located within 5.5 km of the publicly available coordinate.
- Cover of human footprint in catchments surrounding our wetland monitoring sites represent potential sources of disturbance to permanent open water wetlands. Impacts to wetlands themselves were not assessed.
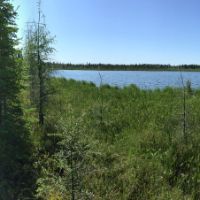
- ABMI wetland monitoring sites are randomly selected from a pool of eligible wetlands surrounding each 20 km x 20 km grid location. The eligibility criteria favour permanent shallow open water wetlands that are at least 1 ha in size and 0.5 m deep in July. It is likely that there is less human footprint surrounding these wetlands than other wetland types because areas with permanent surface water or saturated soils are usually not good candidates for development and are easy to identify and avoid. For example, the Prairie Habitat Joint Venture tracked wetland losses from 1985 to 1999 in the Grassland and Parkland/Boreal Ecoregions in Alberta, Saskatchewan, and Manitoba and found relatively small losses in deep marshes and open water compared to sedge/grass and crop/summer fallow wetland types[10].
- The analysis was based on spatial datasets (digital elevation model, Human Footprint Inventory (2021)) that are not 100% accurate. Our results reflect these inaccuracies.
- The scale of the catchments in this analysis is localized and related to each individual wetland. This scale is smaller than other watershed units used for management purposes (e.g., Hydrologic Unit Code 8, 10, etc.).
- This analysis does not capture loss of wetlands.
Results

The average percent cover of human footprint (circa 2021) in catchments surrounding SOW monitoring sites in Alberta, by natural region, is:
71.1%
Parkland
54.0%
Grassland
20.2%
Foothills
14.1%
Boreal Forest

15.5%
Rocky Mountain
0.0%
Canadian Shield
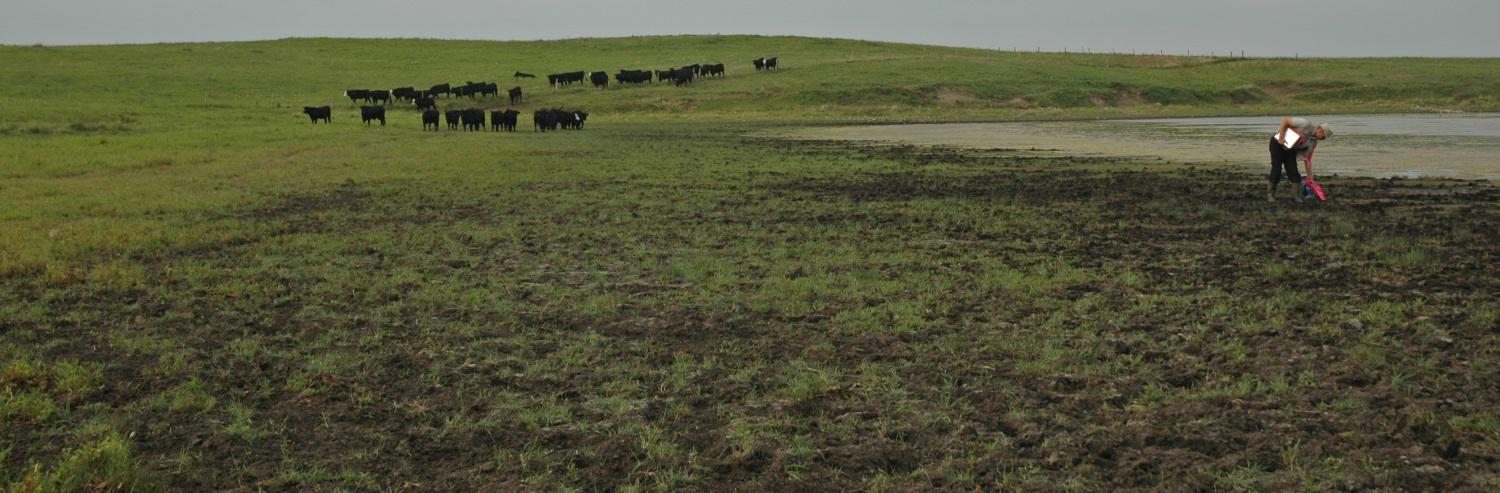
- Agriculture footprint was highest in SOW catchments in three of the six natural regions: Parkland (52.4%), Grassland (40.6%), and Boreal Forest (7.0%). Agricultural runoff can affect the water quality of wetlands by introducing nutrients and sediment, which can change habitat conditions and disrupt chemical and biological processes.
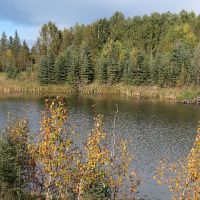
- Forestry footprint was the most common footprint type around SOW in the Foothills (13.0%) and Rocky Mountain (7.4%) natural regions. Forestry activities rarely directly target wetland areas. However, nearby operations can impact wetlands in several ways, including soil compaction from heavy equipment, changes in evaporation due to the harvesting of adjacent uplands, and introduction of invasive species.
- Urban/industrial footprint was the second most common disturbance around SOW in the Parkland Natural Region, at 11.4%. Impacts to wetlands in urban areas are numerous, but the most severe are total loss due to land cover transition from wetland to developed areas.
- The linear nature of transportation footprint makes it likely to intersect and impede natural water flow on the landscape. This could disrupt normal inflows and outflows of wetlands or flowing wetlands themselves (like fens), changing the hydrology.
- Overall, there is a lot of variability in the amount of human footprint cover surrounding SOW within natural regions. For total human footprint and for most of the footprint types, there are many site catchments with 0% coverage but there are also catchments with 100% coverage of human footprint.
- Generally, footprint increased in all human footprint sectors in all natural regions between 2010 and 2021. The Foothills Natural Region had the largest increase in total human footprint (+3.6 percentage points, from 16.6% to 20.2%), followed by the Boreal Forest Natural Region (+1.2 percentage points, from 12.9% to 14.1%).
- The largest increase in individual footprint types was for forestry in the Foothills Natural Region (+3.0 percentage points, from 10.0% to 13.0%).
- The wetland sites in the Canadian Shield Natural Region had no human footprint in their catchments in 2010 or 2021, so show no change.
- Agriculture was the only footprint type that declined between 2010 and 2021, and only in the Parkland Natural Region where there was a slight reduction of 0.3 percentage points (52.7% to 52.4%). This could be due to conversion to other human footprint types.
- Overall, there is a lot of variation in how much human footprint changed between sites, as indicated by the relatively high standard deviation values for the average change in each natural region.
Spotlight on Impervious Surfaces
- In 2021, the area of impervious surfaces was highest in the Parkland Natural Region (8.1%), followed by the Grassland (5.0%) and Foothills (4.0%) Natural Regions. The Rocky Mountain (2.3%) and Boreal Forest (2.2%) natural regions had similar levels of impervious surface coverage.
- Average impervious surface area increased from 2010 to 2021 for every natural region except the Canadian Shield, where there was no human footprint cover in site catchments in either year.
- The largest increase in impervious surface area was in the Foothills Natural Region catchments (+0.6 percentage points, from 3.4% to 4.0%), followed by the Boreal Forest Natural Region catchments (+0.4 percentage points, from 1.9% to 2.3%). Increases in the other natural regions were 0.2 percentage points or less.
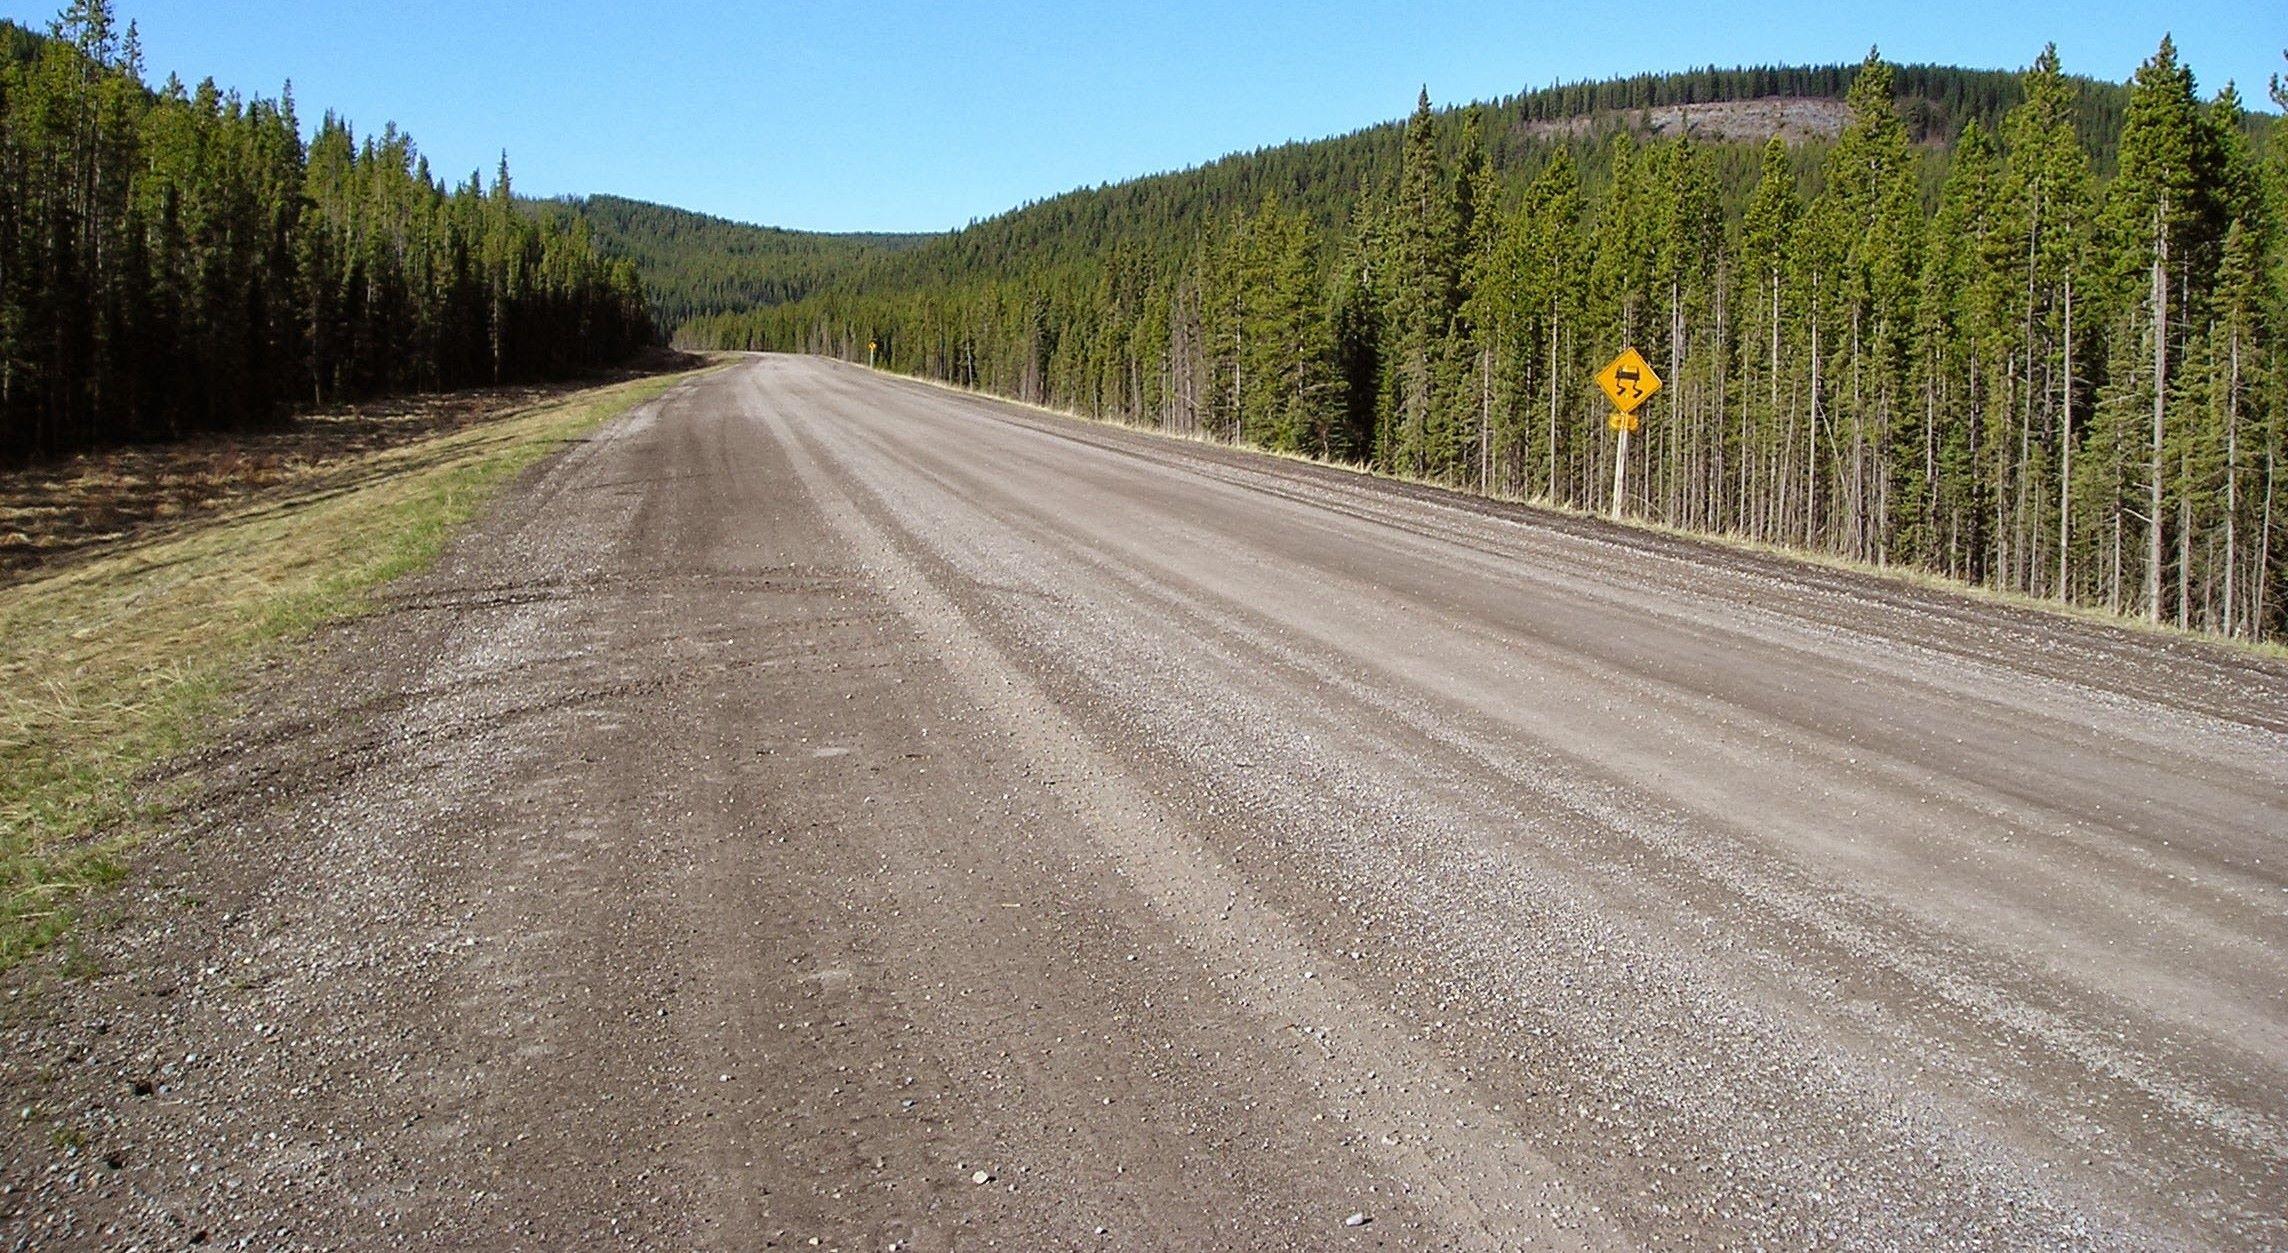
Impervious surfaces, such as roads, alter natural water flow and drainage patterns within wetland catchments.
Future Direction
- Quantifying and summarizing the amount and type of human footprint surrounding our wetland sites could indicate potential impacts to SOW across the province. We will continue to explore how human footprint surrounding wetlands can be monitored.
- We are interested in continuing to improve our wetland catchment delineation methods. We are currently exploring GIS methods to directly calculate smaller scale catchments, which would eliminate the need to use the 250-m buffer cut offs. Further, isotope information we already collect at our sites can be used to describe site hydrology[11] and could be used to inform catchment delineation. These refinements are expected to improve our wetland species–habitat models.
- There is a need to assess impacts of human development activities—including wetland loss—on other wetland classes (e.g. marshes, bogs, fens). Loss of wetlands can disproportionately impact small, semi-permanent wetlands compared to permanent open water wetlands[7].
 Jesse Watkins
Ice road
References
Association of Alberta Municipalities. 2024. Watershed Management. Website. Available at: https://www.abmunis.ca/advocacy-resources/environment/water-management/watershed-management
Lopez, R.D. and M.S. Fennessy. 2002. Testing the floristic quality assessment index as an indicator of wetland condition. Ecological Applications 12(2):487-497. Available at: https://doi.org/10.1890/1051-0761(2002)012[0487:TTFQAI]2.0.CO;2
Brown, M. and M.B. Vivas. 2005. Landscape development intensity index. Environmental Monitoring and Assessment. 101(1-3):289-309. Available at: https://doi.org/10.1007/s10661-005-0296-6
Wilson, M.J. and S.E. Bayley. 2012. Use of single versus multiple biotic communities as indicators of biological integrity in northern prairie wetlands. Ecological Indicators 20:187-195. Available at: https://doi.org/10.1016/j.ecolind.2012.02.009
Kutcher, T.E. and G.E. Forrester. 2018. Evaluating how variants of floristic quality assessment indicate wetland condition. Journal of Environment Management 217:231-239. Available at: https://doi.org/10.1016/j.jenvman.2018.03.093
ABMI. 2022. Status of human footprint in Alberta. Available at: https://abmi.ca/home/reports/2022/human-footprint
Wright-McLaughlin Engineers. 1969. Urban storm drainage criteria manual, volume 1. Prepared for the Denver Regional Council of Governments. Denver, CO: Urban Drainage and Flood Control District.
Mason, B. and R. Knight. 2001. Sensitive habitat inventory and mapping. Community Mapping Network, Vancouver, BC. 315 pp + viii. M. Johannes, editor.
Bochis, C. 2007. The magnitude of impervious surfaces in urban areas. Master’s thesis. The University of Alabama at Tuscaloosa. Tuscaloosa, AL.
Watmough, M., D. Ingstrup, D. Duncan, and H. Schinke. 2002. Prairie Habitat Joint Venture Habitat Monitoring Program. Phase 1: Recent habitat trends in NAWMP targeted landscapes. Technical Report Series No. 391. Canadian Wildlife Service, Edmonton, Alberta. Available at: https://publications.gc.ca/collections/collection_2018/eccc/cw69-5/CW69-5-391-eng.pdf
Gibson, J.J., P. Eby, S.J. Birks, C. Twitchell, C. Gray, and J. Kariyeva. 2022. Isotope-based water balance assessment of open water wetlands across Alberta: regional trends with emphasis on the oil sands region. Journal of Hydrology: Regional Studies 40:101036. Available at: https://doi.org/10.1016/j.ejrh.2022.101036
Contributors

Dr. Jenet Dooley, Senior Wetland Ecologist, Alberta Biodiversity Monitoring Institute (ABMI)
Jenet has been working at the ABMI since February 2019. She leads varied wetland analysis and monitoring initiatives involving many wetland taxa, including amphibians.
If you have questions about the ABMI's wetland monitoring program, please get in touch: jenet.dooley@ualberta.ca

Brandon Allen
Brandon Allen, Senior Terrestrial Ecologist, Alberta Biodiversity Monitoring Institute (ABMI)
Brandon joined the ABMI in 2016. He currently leads the development of multiple landscape-scale biodiversity indicators and has become passionate about amphibians.
If you have questions about the ABMI's amphibian monitoring program, please get in touch: brandon.allen@ualberta.ca
We are grateful for the support of the ABMI's delivery partners.

We would like to acknowledge the organizations and sponsors highlighted below who financially supported the development of this report.