Section 4.1
Aquatic Invertebrate Diversity
Summary of aquatic invertebrate abundance, richness and diversity in Alberta's natural regions.

- Aquatic invertebrates are good indicators of wetland health.
- Abundance is highest in the more productive Grassland and Parkland natural regions, and lowest in the Foothills and Rocky Mountain natural regions.
- Taxonomic richness is highest in the Canadian Shield and Boreal Forest natural regions, which have a diverse array of habitats, and lowest in the Rocky Mountain Natural Region.
- Taxonomic diversity is comparable across most of the natural regions, but markedly lower in the Rocky Mountain Natural Region.
_Hinchliffe-1.jpg) Rob Hinchliffe
Rob Hinchliffe
Introduction
- Aquatic invertebrates are taxonomically diverse, and also have diverse life histories and ecological roles. For example, some aquatic invertebrate groups have adapted to exploit specialized niches, like tunneling through rotten wood, mining the leaves and stems of plants, and burrowing in anoxic sediment.
- Functional feeding groups are equally diverse, including filter feeders, decomposers, primary consumers and predators.
- Because of their close ties with biological processes, aquatic invertebrate communities directly reflect the ecological conditions of a waterbody and its ability to support life. They therefore serve as effective bioindicators of change.
- The biological integrity of aquatic ecosystems can be measured in terms of aquatic invertebrate diversity, community structure, and overall abundance within the system.
The Alberta Biodiversity Monitoring Institute (ABMI) has been collecting monitoring data on aquatic invertebrates in Alberta since 2007. Here we present results summarizing regional patterns in invertebrate abundance, richness and diversity.
_Hinchliffe-1.jpg) Rob Hinchliffe
Rob Hinchliffe
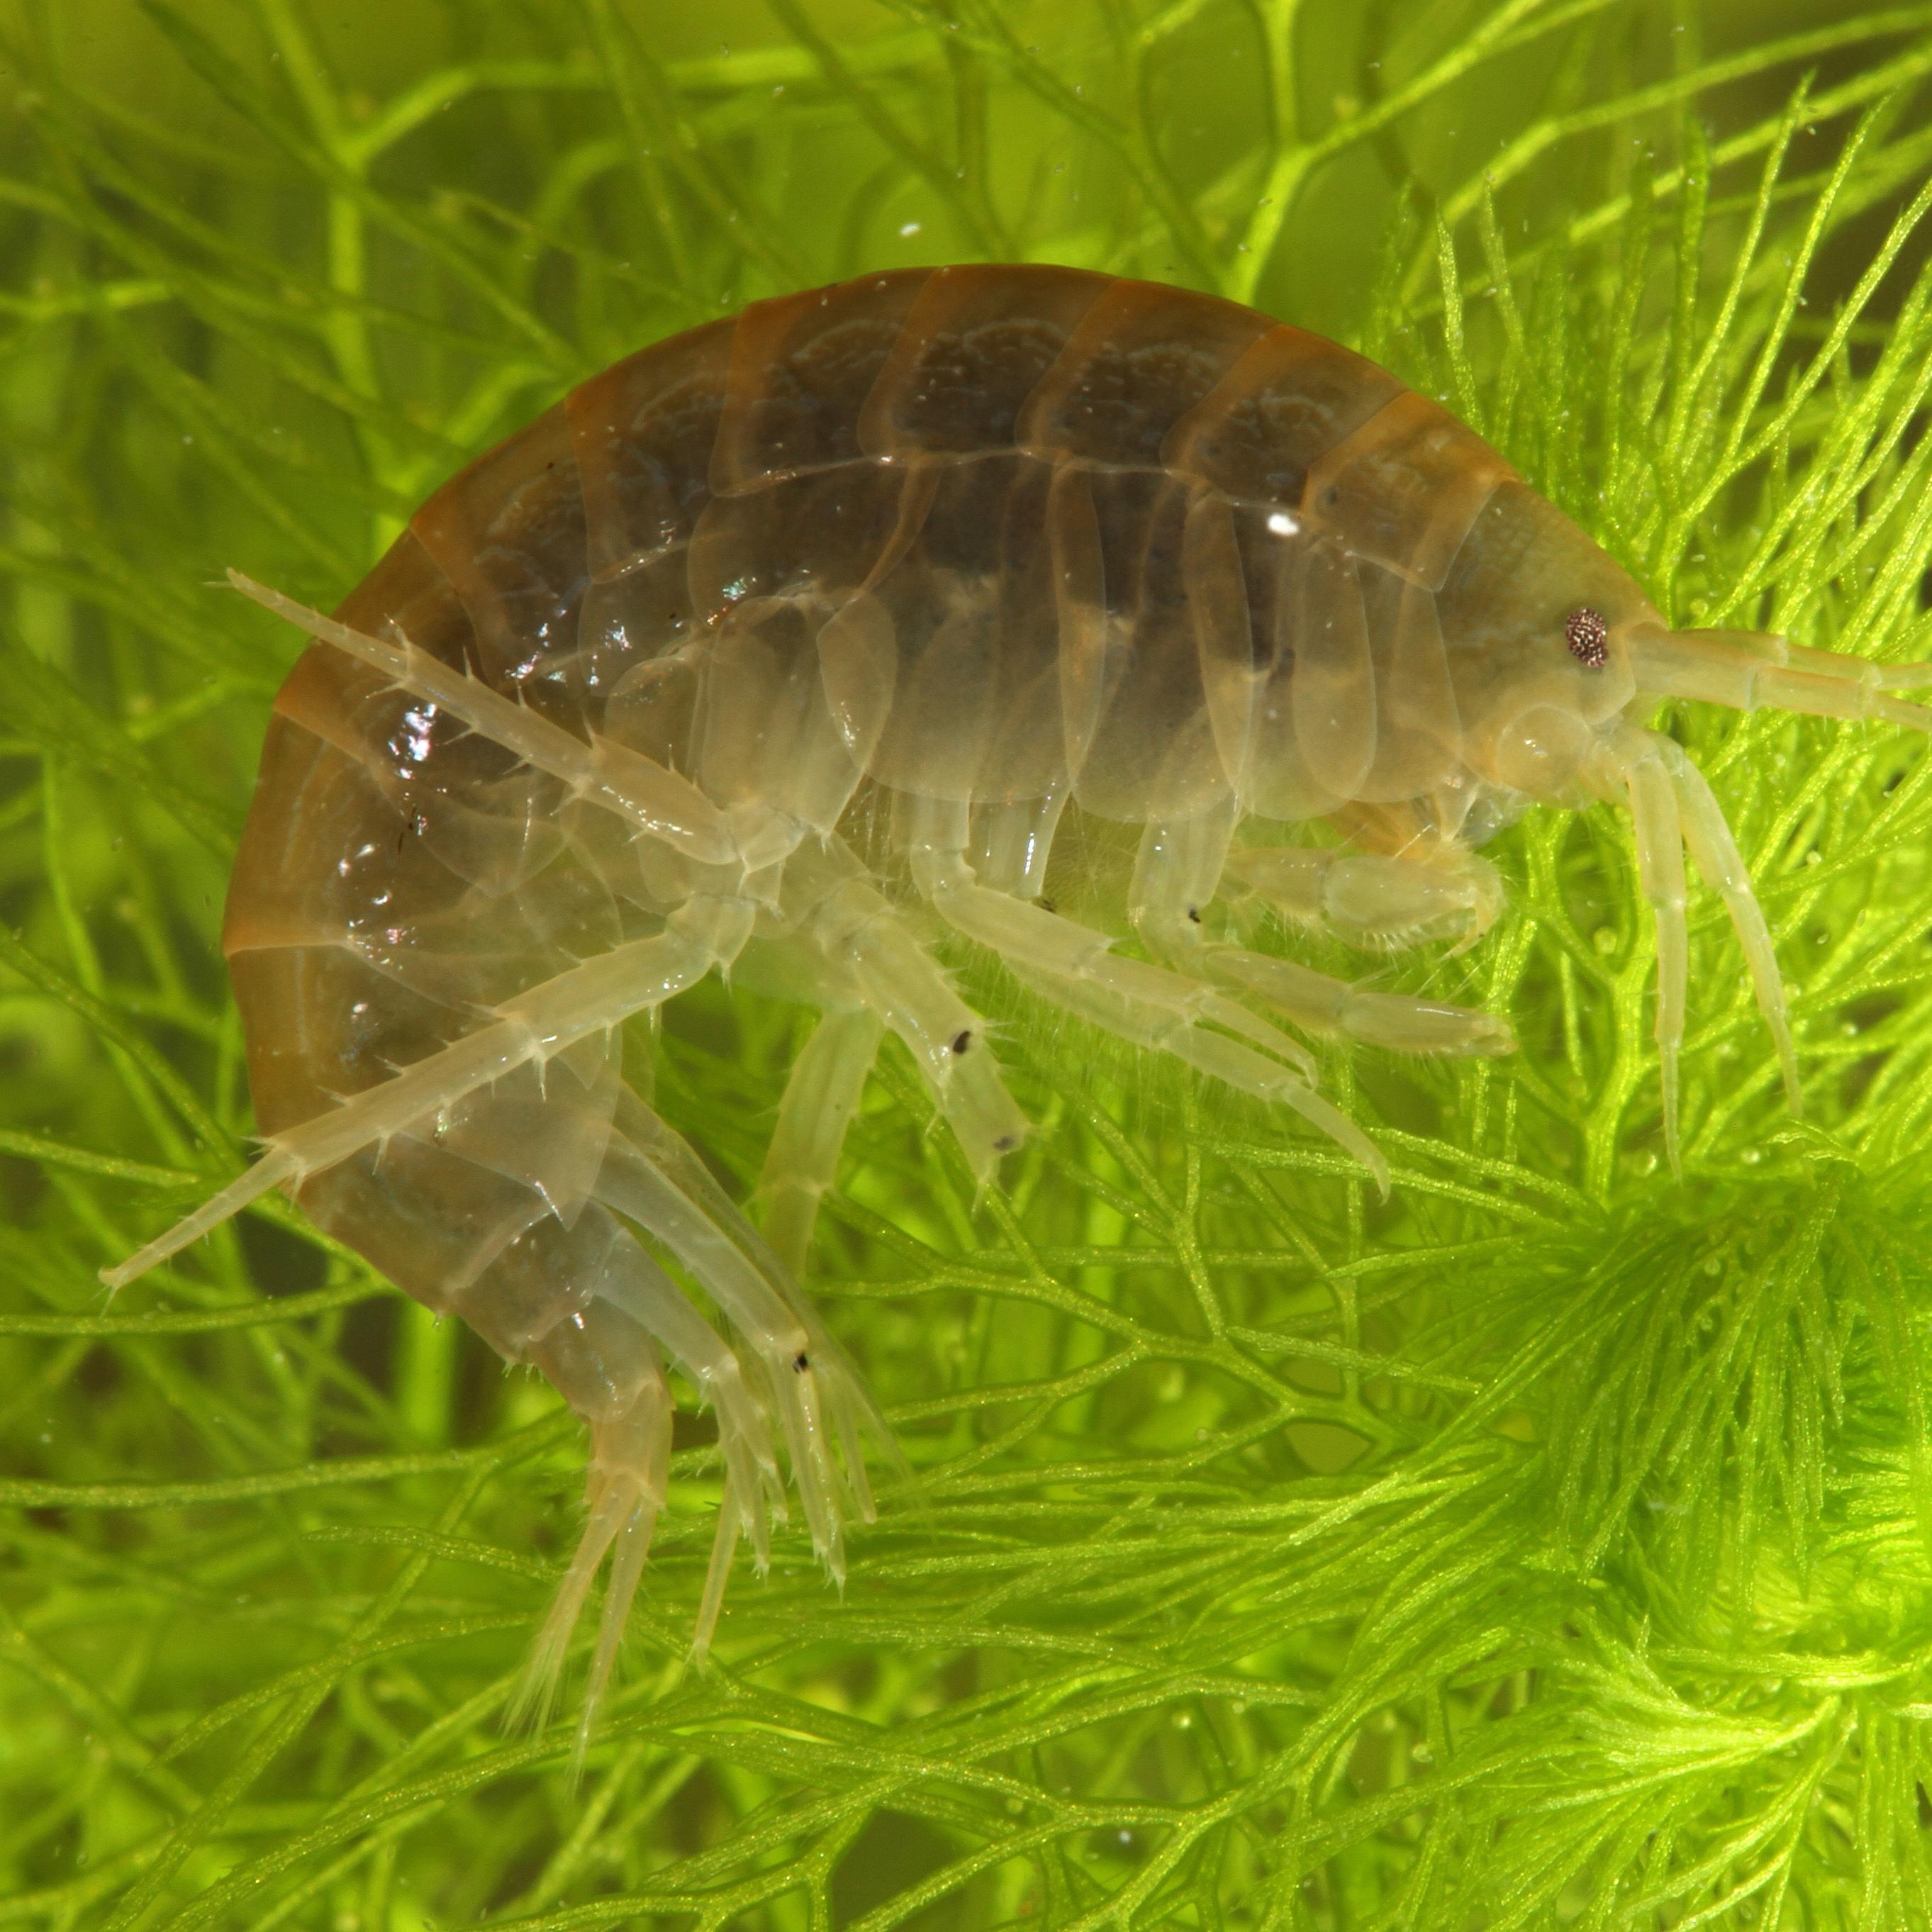
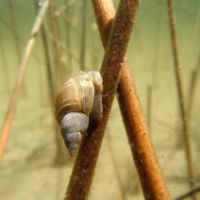
Aquatic invertebrates form a large part of the biomass in wetlands, reaching very high densities of thousands to tens of thousands of individuals per cubic metre.
 Rob Hinchliffe
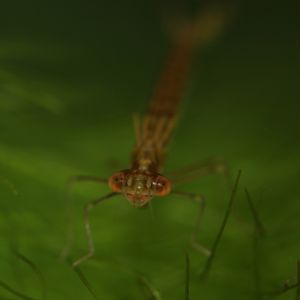
They fill a variety of ecological roles, from decomposer to predator. Here, a damselfly nymph (Lestes species) lies in wait for unsuspecting prey.
 Rob Hinchliffe
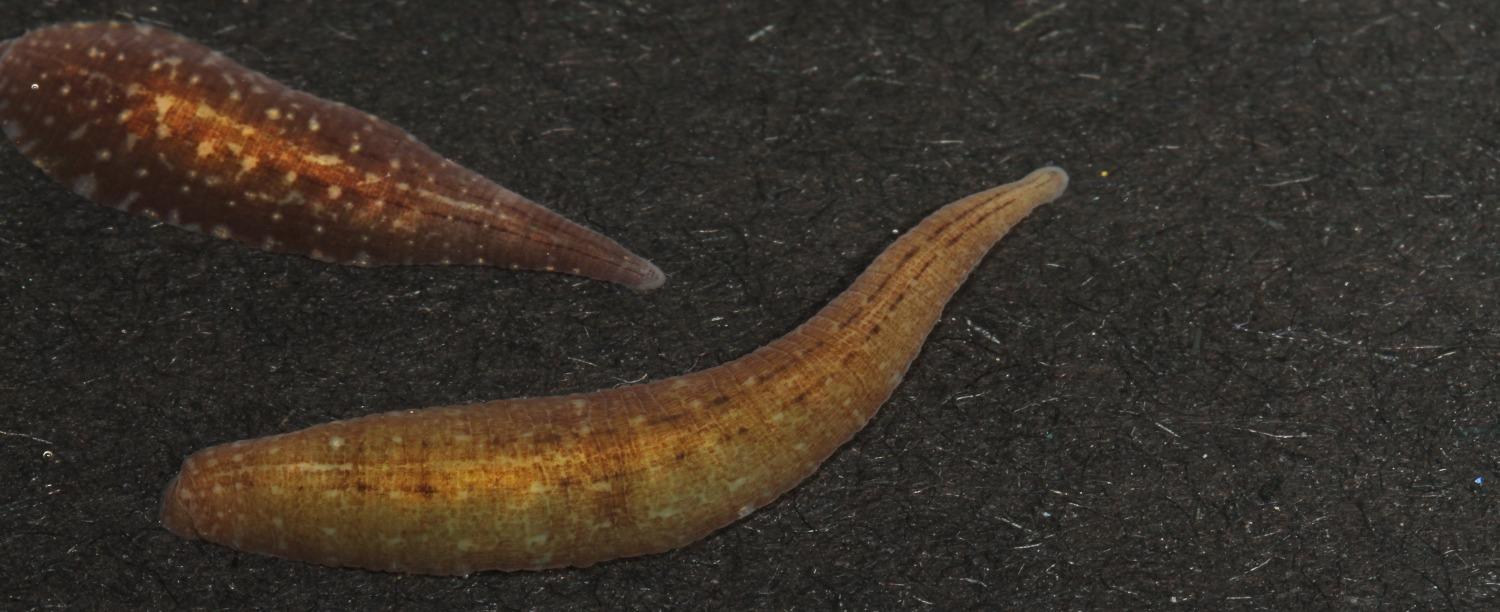
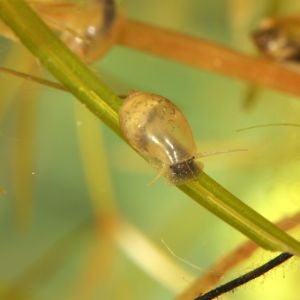
Aquatic invertebrates are the primary drivers of many key biological processes that allow wetland ecosystems to function effectively.
_Hinchliffe-1.jpg) Rob Hinchliffe
Rob Hinchliffe
High reproduction rates and short life cycles are two characteristics that make aquatic invertebrates a useful indicator of environmental change in wetlands.
Spotlight on Shredders
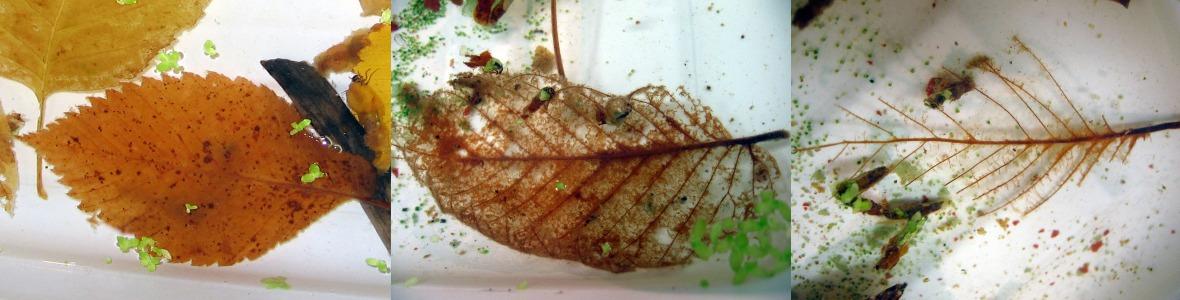
- Shredders are a common functional feeding group in forest-fringed wetlands that have lots of leaf litter input. Species in this group physically tear or “shred” leaf litter into small pieces for consumption.
- Coarse shredded material is digested, and the remains are excreted as small particles that, in addition to uneaten shredded vegetation, are fed upon by smaller invertebrates (chironomids, tiny aquatic worms, etc.).
- This feeding activity also serves to increase the available surface area for fungi and bacteria to aid in the decomposition process—both of which are in turn fed upon by other invertebrates.
- Without shredders, leaf litter would accumulate much faster than it could be broken down by fungi and bacteria alone.
 Rob Hinchliffe
Just a few Nemotaulius larvae have skeletonized a leaf in less than 24 hours, leaving behind small particles.
Methods
Sampling Methods
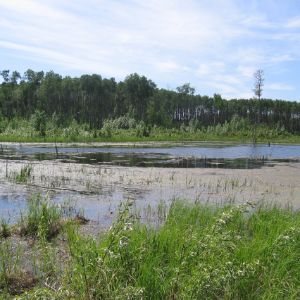
- Alberta is home to a diverse set of wetland types, many of which exist as wetland complexes where two or more wetland classes are linked on the landscape (e.g., an open water wetland bordered by a bog).
- ABMI aquatic invertebrate sampling is focused on the submerged aquatic vegetation zones of shallow open water, where invertebrate biodiversity is highest.
- Samples are collected in the field, preserved, and brought back to the lab for processing and specimen identification.
- This consistent approach allows for the comparison of metrics (diversity, richness, etc.) within each natural region using nested data at the lowest taxonomic level for each taxon.
- For detailed methods, see field protocols[1] and lab processing protocols[2].
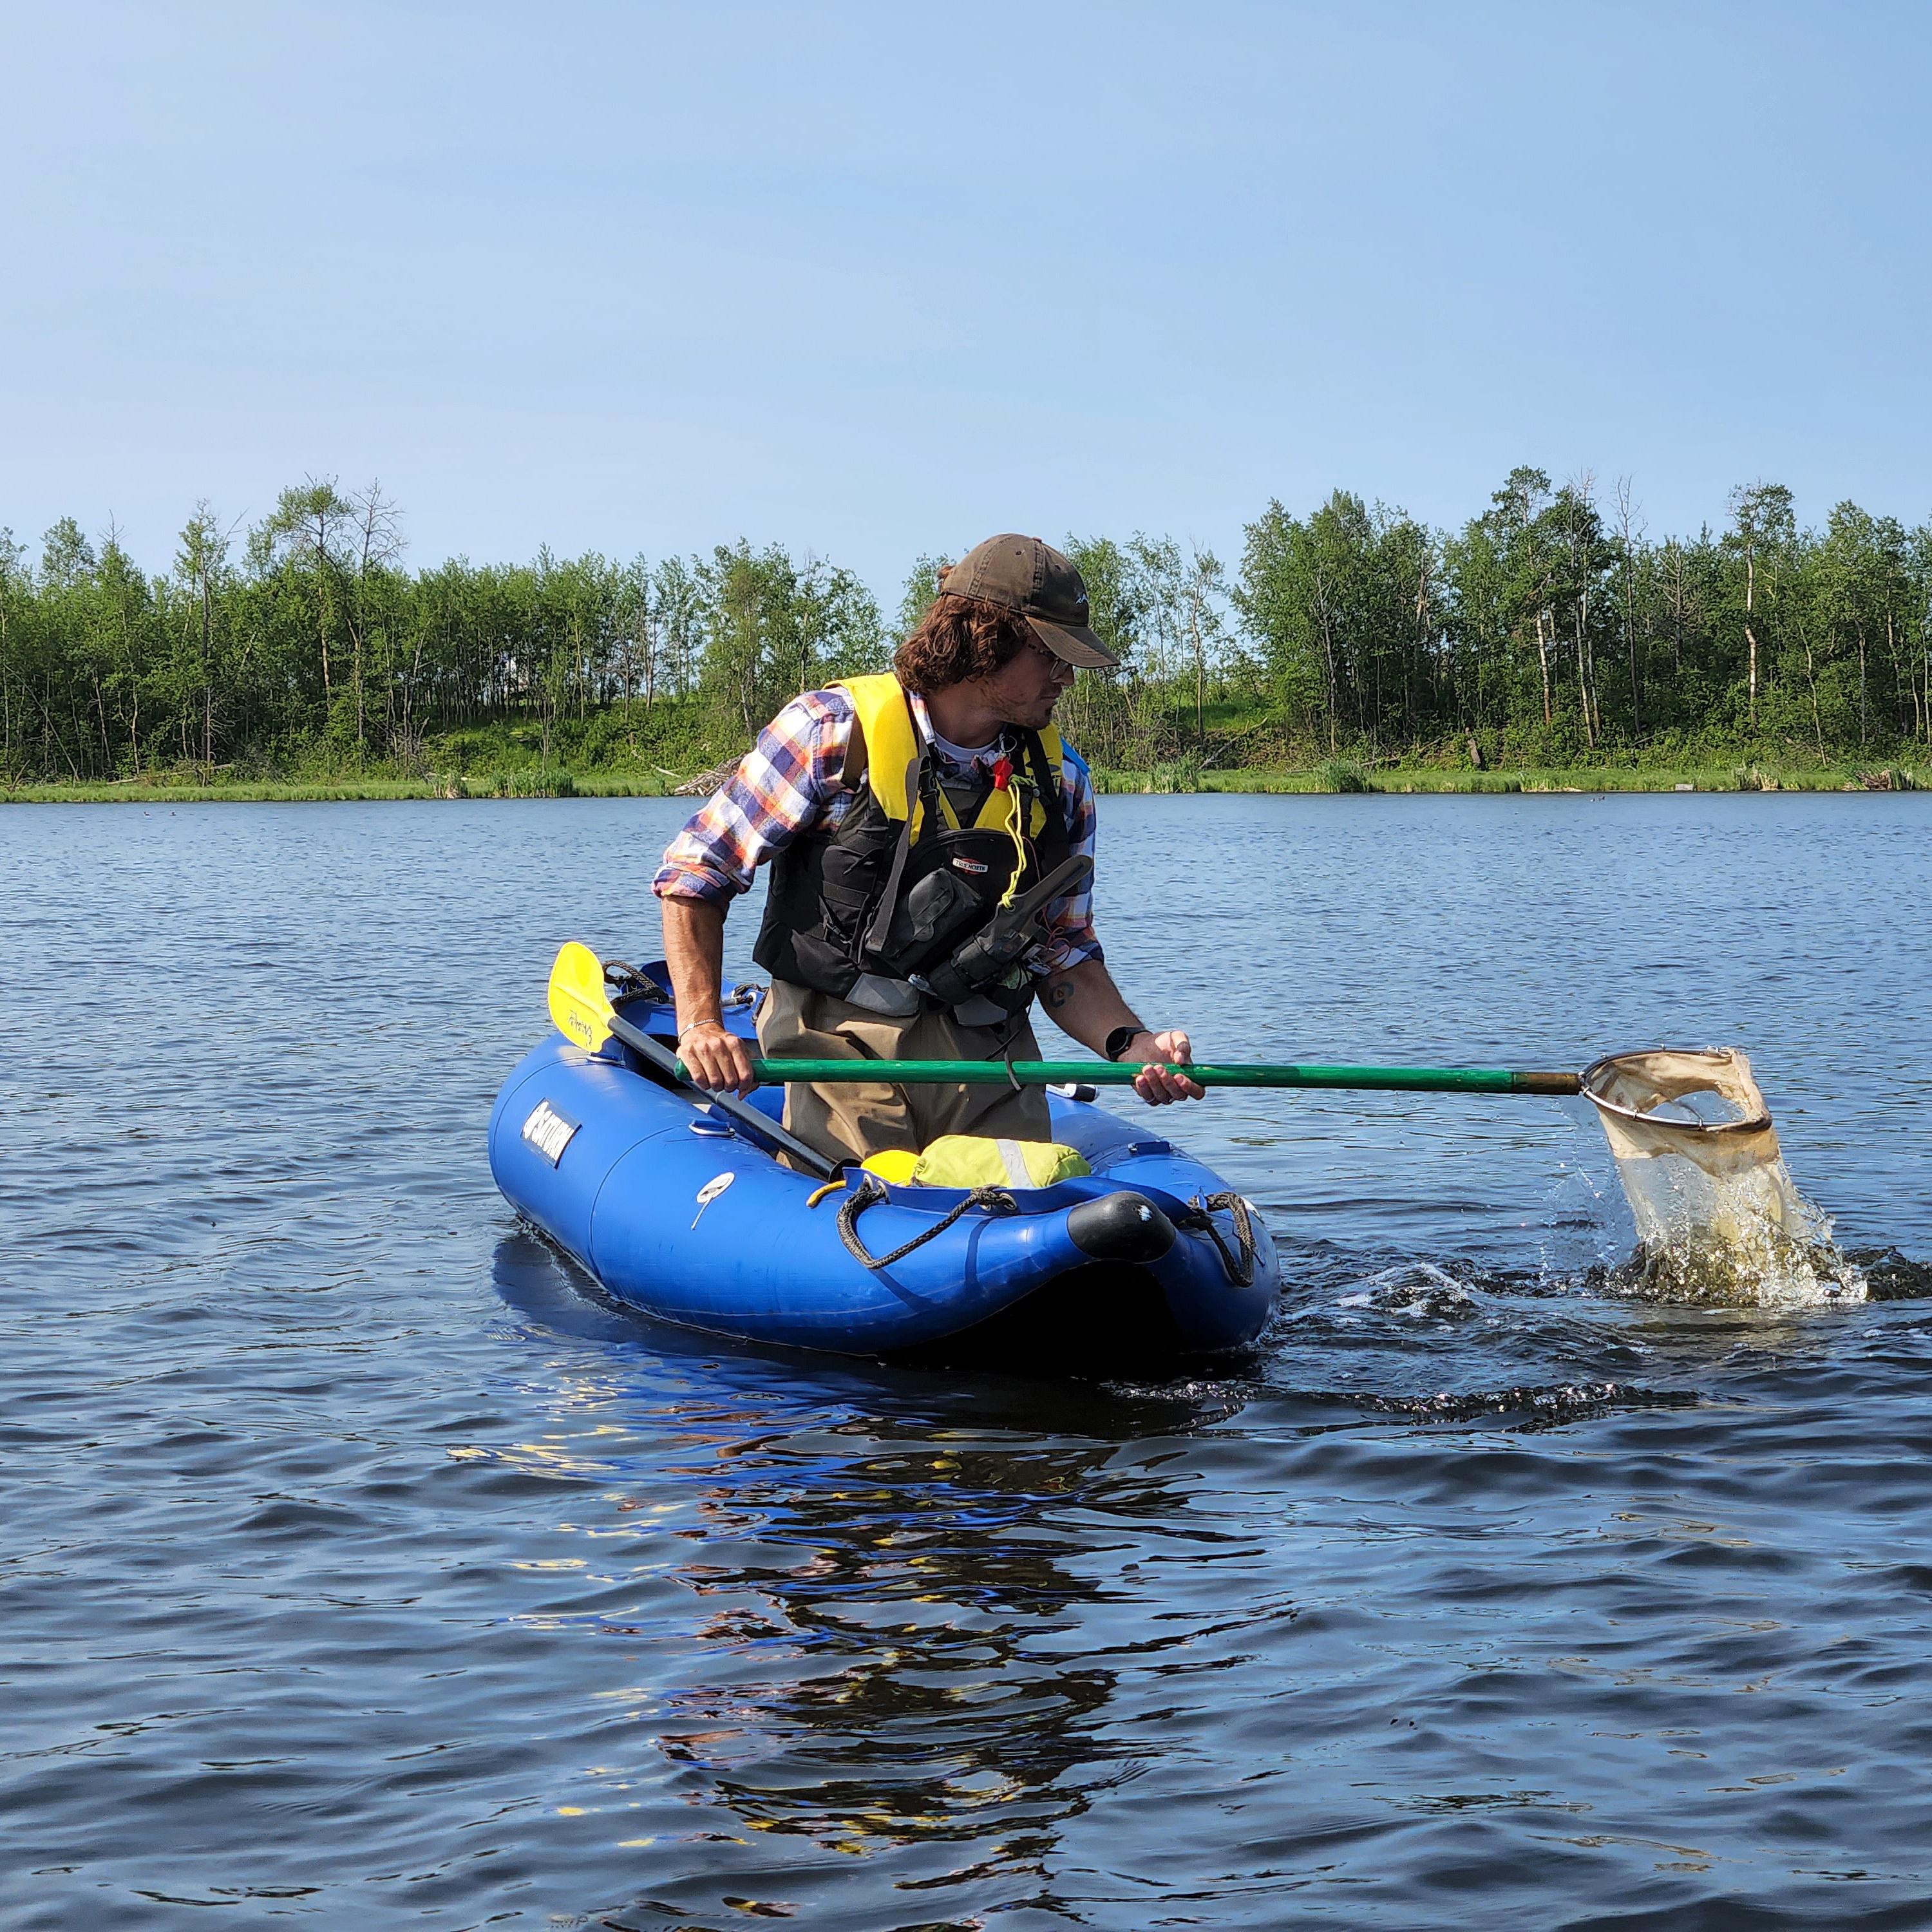
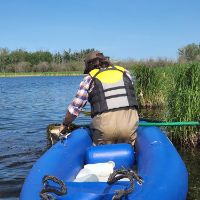
Aquatic invertebrates are collected in the field...
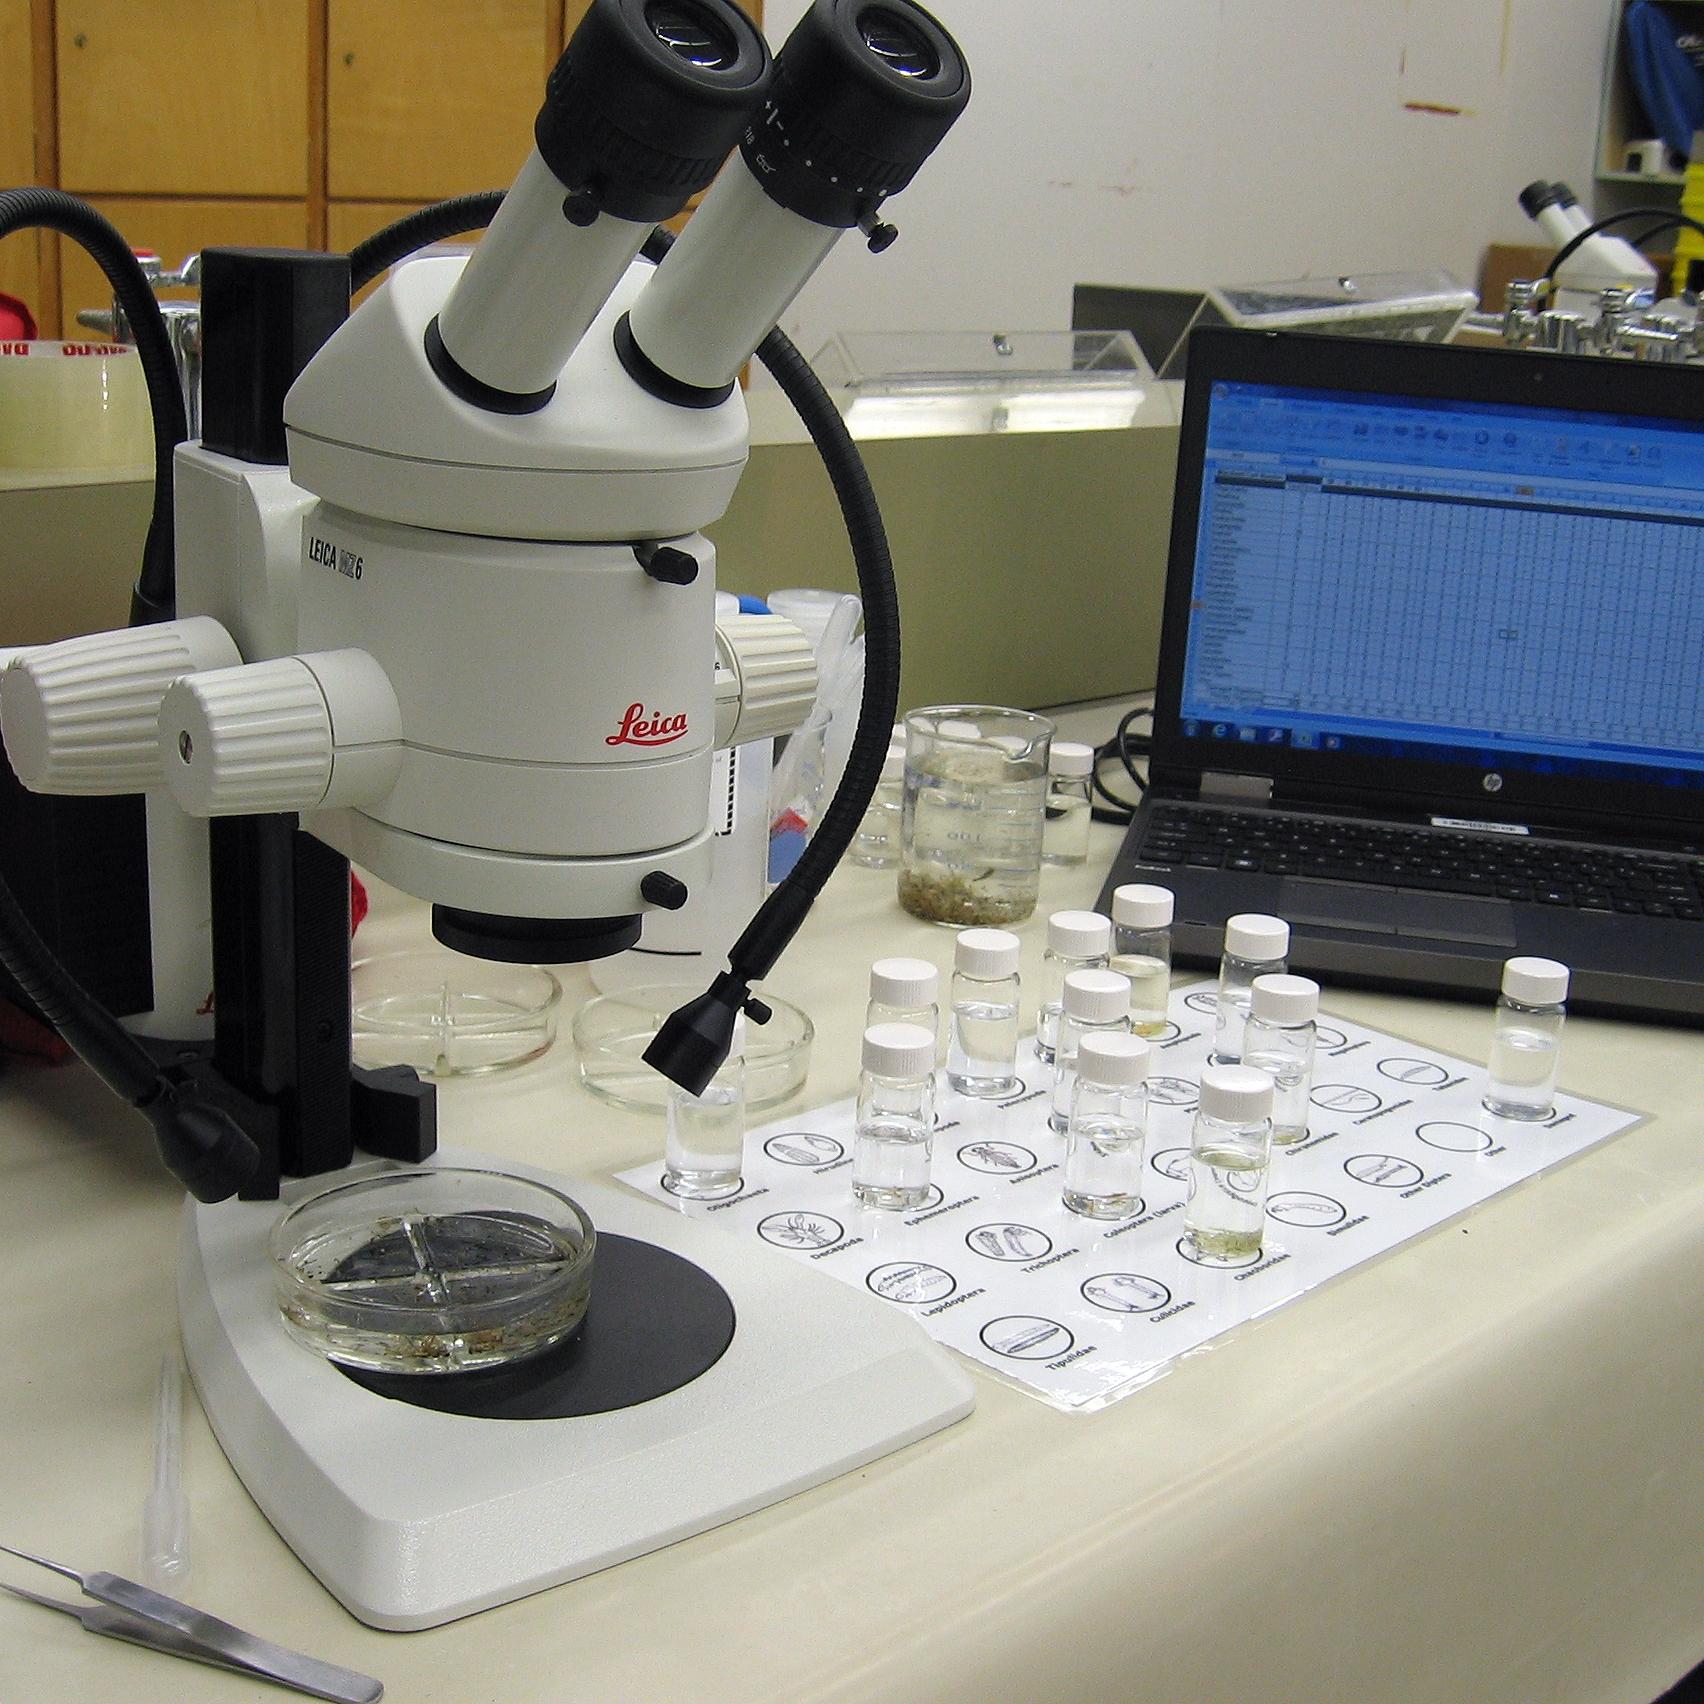
...and processed and identified in the lab.
Analysis Methods—Basic Measures of Biodiversity
 Rob Hinchliffe
Regional Abundance: Abundance is the total number of aquatic macroinvertebrate specimens contained in each wetland sample. Total abundance in each sample is representative of the abundance of invertebrates in the wetland as a whole, and is an indicator of wetland productivity. It is often used as a primary metric when calculating an index of biotic integrity for aquatic ecosystems. Abundance can give us an indication of general trends in wetland productivity in each natural region.
 Rob Hinchliffe
Taxonomic Richness: Taxonomic richness is the number of distinct taxonomic groups identified in each sample. Richness is count independent, meaning it is a measure of presence-absence of each taxon. A high richness value is an indication that the ecological conditions in a wetland are able to support a wide array of organisms. Taxonomic richness is another primary metric used to calculate an index of biotic integrity for aquatic ecosystems, and can give us an indication of the ecological conditions of wetlands in each natural region.
_Hinchliffe-1.jpg) Rob Hinchliffe
Rob Hinchliffe
Regional Diversity: The Shannon-Wiener Diversity Index (H’) is a quantitative measure of the relative taxonomic diversity within a sample, which includes both the number of taxonomic groups and the evenness of counts across groups.
- If a wetland has a high level of richness, and most of the groups are present in low numbers with one or two taxa with much higher abundance, the diversity value will be low.
- The highest diversity values are seen in ecosystems where there are many taxonomic groups present in relatively equal numbers.
Diversity values on their own have little meaning; they must be compared to other diversity values within a common dataset. Like richness, diversity is a primary metric used to calculate indices of biotic integrity for aquatic ecosystems, and can give us an indication of the ecological conditions of wetlands in each natural region.
- ABMI wetland monitoring sites are randomly selected from a pool of eligible wetlands surrounding each 20 km x 20 km grid location. The eligibility criteria favour permanent shallow open water wetlands that are at least 1 ha in size and 0.5 m deep in July. In areas where this wetland type is rare, monitoring sites may be waterbodies with depths greater than 2 m.
- ABMI aquatic invertebrate sampling protocol involves collecting samples from both the near-shore areas and farther out (up to 50 m). In wetlands deeper than 2 m the net does not always reach the aquatic vegetation, resulting in lower aquatic invertebrate abundance, diversity and richness values from deeper wetlands.
- Richness and diversity analysis was limited to ABMI target organism data. Interpretation of regional differences is based on broad regional characteristics—specific environmental factors were not included in the analysis.
Results

The biodiversity of aquatic invertebrates in Alberta was measured using three indicators. Click on a tab below to view results.
- Regional abundance is the total number of specimens in a region.
- Wetlands in the Grassland and Parkland natural regions have, on average, the highest total abundance counts. Wetlands in these regions tend to be warmer, and to have longer growing seasons and higher nutrient inputs (falling leaves, agricultural runoff, etc.). Nutrient inputs and rich organic sediments result in prolific aquatic plant growth which creates more structurally complex habitats, allowing aquatic invertebrates to reach higher densities.
- Boreal Forest and Canadian Shield wetlands have a moderate abundance of aquatic invertebrates. Located in northern Alberta, these wetlands are ice-free for shorter periods of time and have lower water temperatures than those in the south. In addition, the open water component of wetland complexes in these regions is often connected to nutrient poor bogs and fens where decomposition and nutrient turnover is slow, resulting in lower numbers of aquatic invertebrates.
- The lowest average abundance of aquatic invertebrates is in wetlands in the Foothills and Rocky Mountain natural regions. Many of these wetlands are at higher elevations, and have short growing seasons and low nutrient inputs. Wetlands in the Rocky Mountain Natural Region are generally small alpine or subalpine tarns with rocky substrates and very sparse or no aquatic plant growth. Wetlands in the foothills tend to have more organic inputs than mountain wetlands, but the sediment layer is often restricted to a thin deposit on top of bedrock or glacial till. The lower productivity supports fewer aquatic invertebrates.
- Taxonomic richness refers to the number of distinct taxonomic groups within a region.
- Low productivity (abundance) does not always translate into low taxonomic richness.
- The moderately productive wetlands of the Boreal Forest and Canadian Shield natural regions have on average the highest target organism richness in the province. This means that even though the wetlands in these regions contain less invertebrate biomass, the habitats are diverse enough to support a rich array of organisms.
- Richness values in wetlands of the Rocky Mountain Natural Region are limited by the lower number of aquatic invertebrate groups that are adapted to sparse, high elevation environments.
- Regional diversity is a measure of both the number of taxonomic groups and the evenness of numbers of specimens across these groups.
- On average, wetlands across the province are comparable in terms of target organism diversity, with the exception of the Rocky Mountain Natural Region.
- The Parkland and Grassland natural regions have lower diversity values compared to the Boreal Forest Natural Region, but it is not clear yet if this is the result of a higher degree of human footprint in these regions or the result of other natural factors.
- Similar to richness values, diversity shows how wetlands with lower productivity still hold significant value in terms of the biodiversity they support.
Future Directions
Looking at the regional abundance, richness and diversity of aquatic invertebrates is just one piece of the very large wetland biomonitoring puzzle, but it serves as a starting point when considering how human footprint, climate change, and natural variation can affect wetland biodiversity. The next step is to use the aquatic invertebrate community data to determine which metrics show a measurable response to changes in the wetland ecosystem.
 Rob Hinchliffe
References
Alberta Biodiversity Monitoring Institute. 2016. Wetland field data collection protocols (abridged version) 2019-07-02. Alberta Biodiversity Monitoring Institute, Alberta, Canada. Report available at: https://www.abmi.ca/home/publications/501-550/548
Alberta Biodiversity Monitoring Institute. 2015. Processing aquatic invertebrates (10017), 2015-07-23. Alberta Biodiversity Monitoring Institute, Alberta, Canada. Report available at: https://www.abmi.ca/home/publications/351-400/396
Contributors

Robert Hinchliffe, Lead Scientist, Aquatic Invertebrates, Alberta Biodiversity Monitoring Institute (ABMI)
Rob has been involved with the ABMI since 2006. Starting out as an aquatics field crew member testing the prototype sampling protocols, he went on to lead ABMI field operations for the first two years of the project. As an aquatic invertebrate taxonomist, Rob currently leads the processing and identification of aquatic invertebrate samples and assists with data analysis.
If you have questions about the ABMI's aquatic invertebrate monitoring program, please get in touch: robert.hinchliffe@ualberta.ca
We are grateful for the support of the ABMI's delivery partners.

We would like to acknowledge the organizations and sponsors highlighted below who financially supported the development of this report.