Section 2.6
HydroPatterns: Mapping Open Water Presence and Change
This project describes and tests methods for tracking open surface water presence and change over time at the landscape scale.


HydroPatterns is a tool developed to map when and where open water occurs across landscapes in Alberta and how it changes over time.
- The dataset includes monthly open water maps from May to October, seasonal and annual open water frequency maps, and a multi-year average showing longer-term patterns.
- Examples from a boreal landscape and prairie landscape illustrate how open water can remain stable in some wetlands while varying seasonally or from year to year in others.
- Together, these maps can support wetland management, conservation, and land-use planning decisions.
 Marc La Fleche
Introduction
- Hydroperiod refers to the temporal pattern of water presence, describing when water is present and how long it persists at a wetland or waterbody. Some waterbodies are permanent, with stable water levels most of the year, while others are non-permanent and can expand, shrink, or disappear depending on conditions[2],[3].
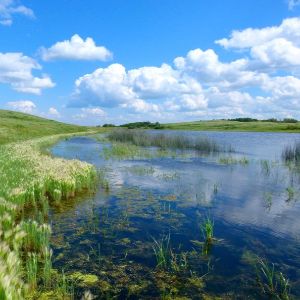
- Hydroperiod patterns vary across Alberta. In the boreal region, waterbodies are often larger and more stable, whereas in the parkland and prairie region, waterbodies tend to be smaller and have more seasonal variability[4],[5].
- The HydroPatterns project was developed to monitor hydroperiod in Alberta, including how long and how often water is present at a wetland or waterbody, and whether it is permanent or seasonal.
- Additionally, HydroPatterns maps when and where water is present across landscapes, illustrating how open water changes in waterbodies among seasons and years.
- In practice, hydroperiod describes changes in water presence at a site, while HydroPatterns captures broader spatial and temporal patterns of water timing and duration.
In this section, we use the HydroPatterns data to describe hydroperiod patterns in Alberta’s Natural Regions, with a focus on regional differences and temporal variation.
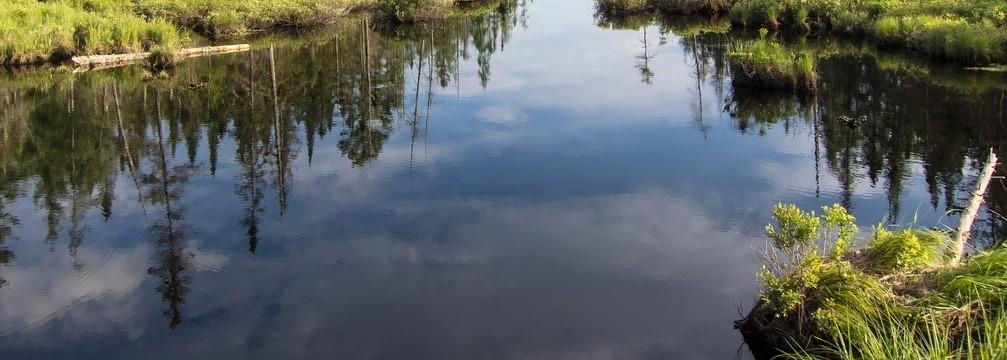
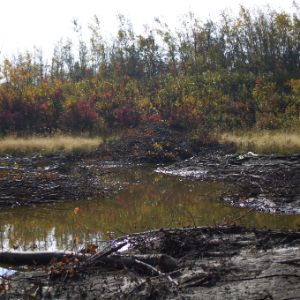
Wetland 1 - Spring
 Jenet Dooley
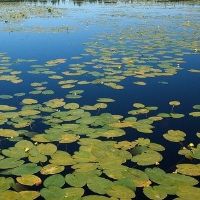
Hydroperiod describes changes in when and how long water is present in a wetland or waterbody.
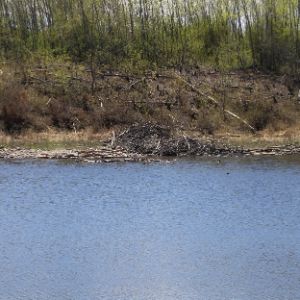
Wetland 1 - Fall
 Jaqueline Dennett
Water levels are influenced by seasonal and climatic conditions, such as precipitation and temperature.
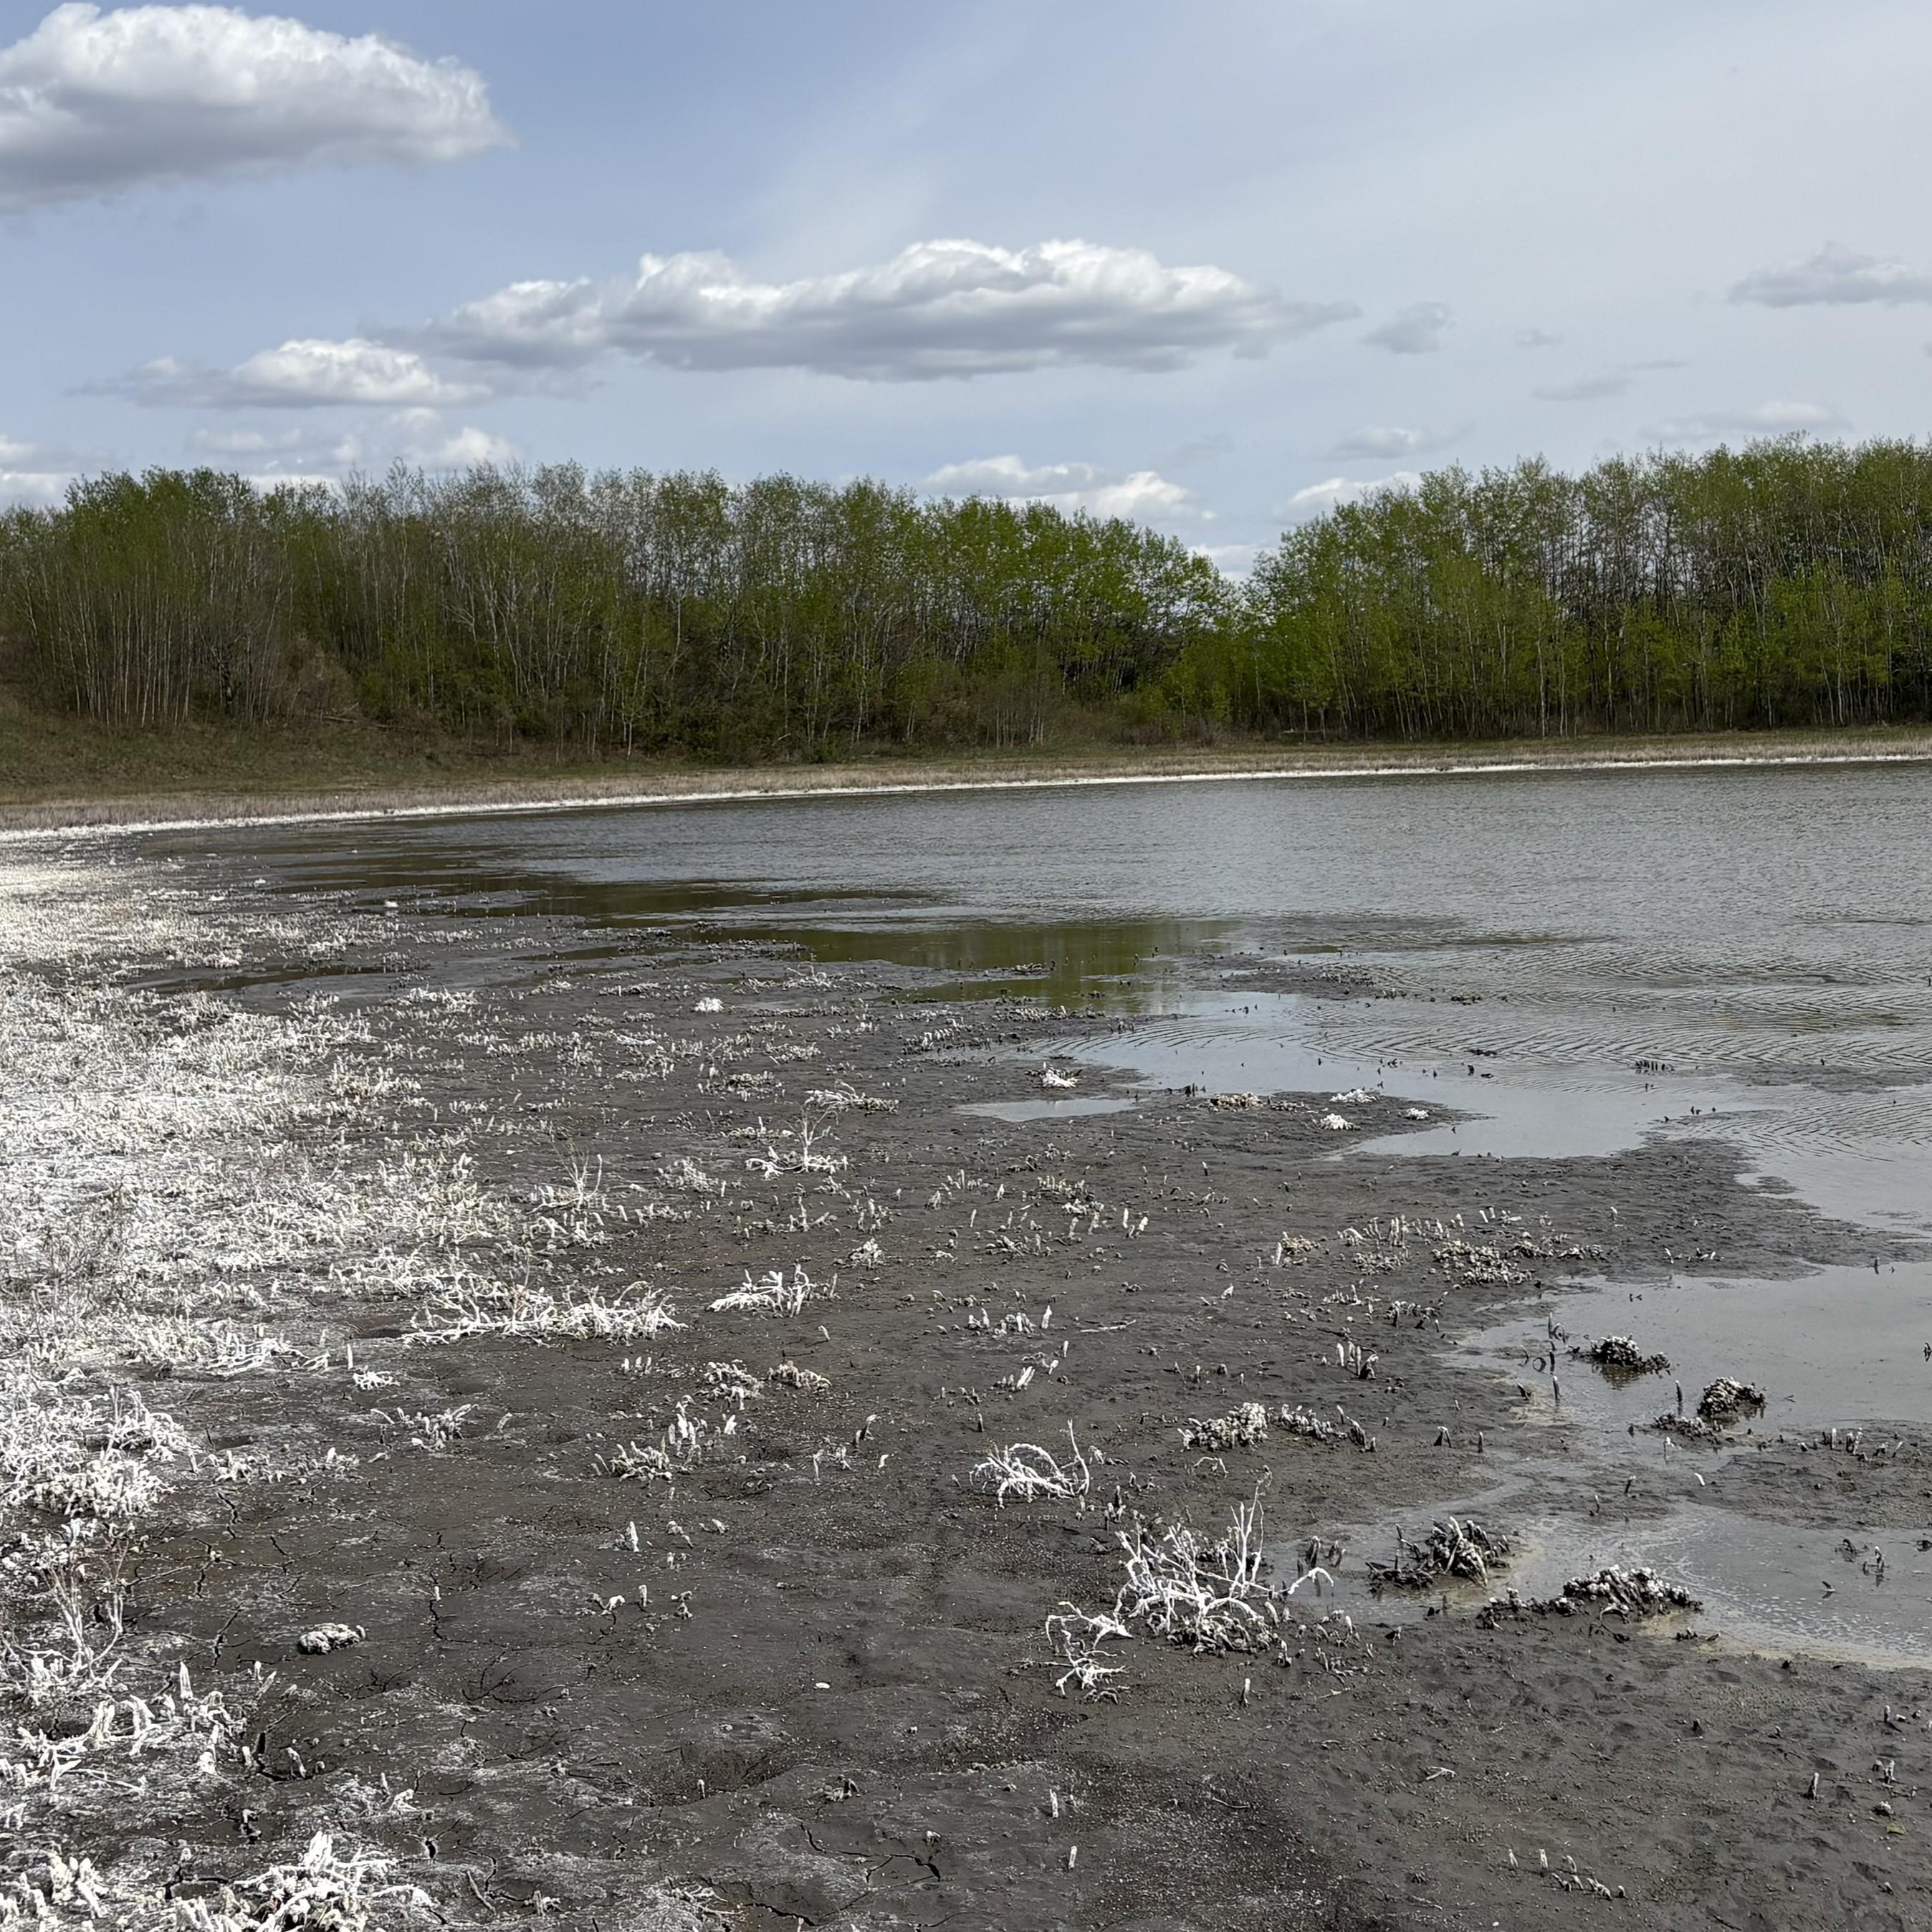
Wetland 2 - Spring
 Jenet Dooley
In one year, the water levels in a lake can have large changes...
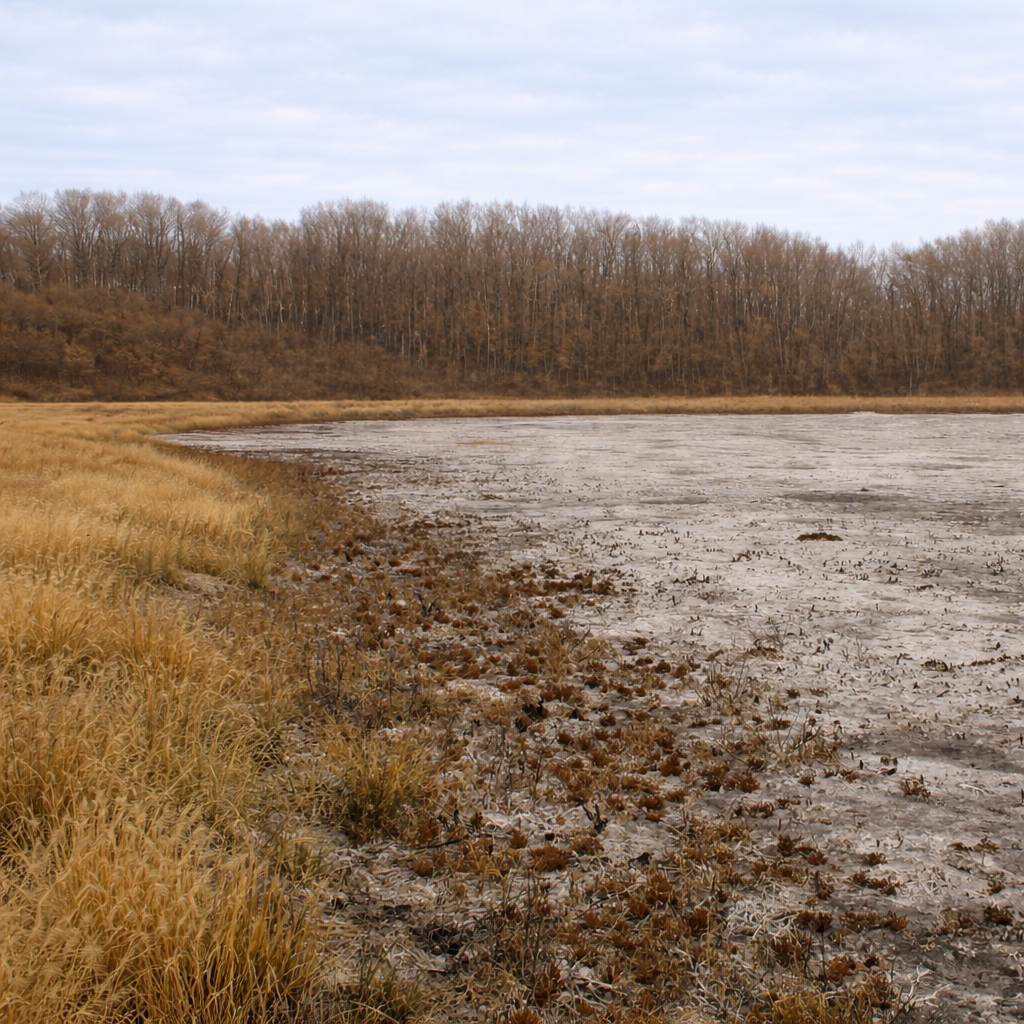
Wetland 2 - Fall
 Jacqueline Dennett
... holding more water earlier in the year than in the fall.
More about hydroperiod
Hydroperiod is a defining characteristic of open water ecosystems because it directly influences ecological function[6],[7],[8].
- Many species depend on water being present for specific lengths of time to feed, breed, and complete their life cycles. Changes in the timing or duration of open water can alter habitat suitability for species that rely on open water ecosystems[5],[6],[1].
- Tracking hydroperiod over time reveals long-term trends in water permanence and variability across landscapes, and can help identify land-use impacts such as drainage, water withdrawals, or altered runoff.
- Hydroperiod responds to climate-driven changes in precipitation and temperature, making it a valuable indicator of climate change impacts on aquatic ecosystems and the species that depend on them[5],[9].
- HydroPatterns helps us understand hydroperiod patterns at the landscape scale—across many waterbodies rather than individual sites—providing a useful coarse-filter indicator of change in open water ecosystems, including patterns linked to wetland drying and loss. This information can support practical management decisions related to water management and wetland and wildlife conservation.
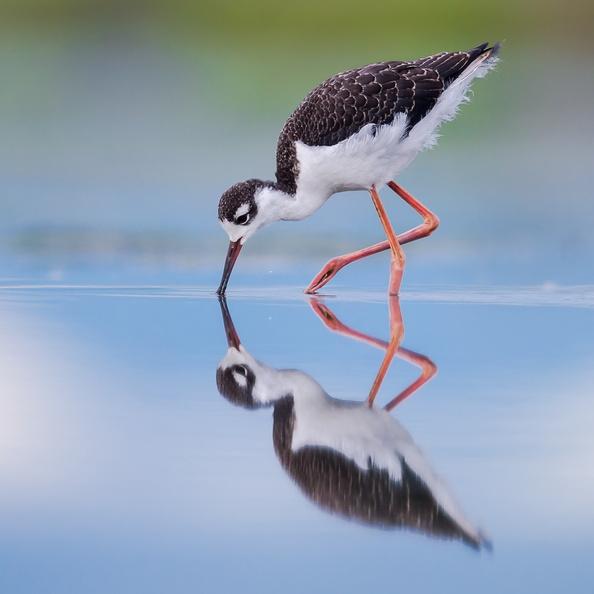
Black-necked Stilts use open, shallow water to nest and forage on aquatic invertebrates.
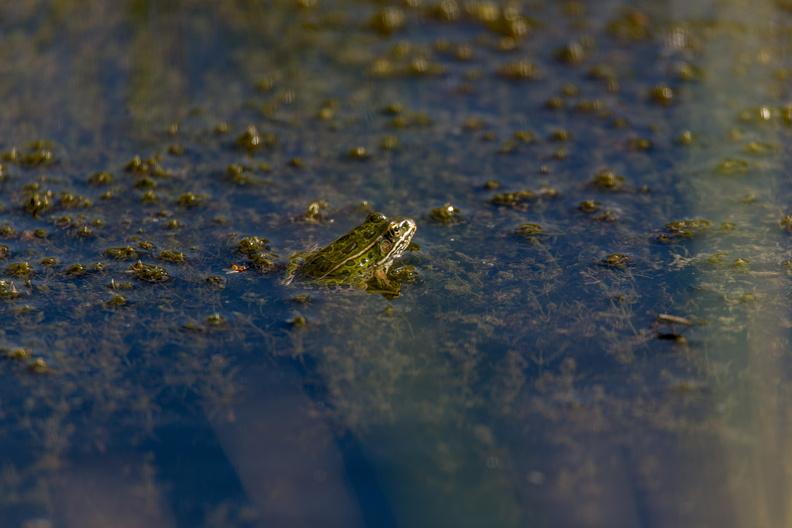
Northern Leopard Frogs need water long enough for their eggs to hatch and tadpoles to develop.
Methods
The goal of the HydroPatterns project was to develop an efficient, scalable, automated, and repeatable approach to mapping hydroperiod across large areas.
- To do this, two study areas were selected for analysis: the boreal study area is in the Boreal Forest Natural Region and the prairie study area is mainly in the Parkland Natural Region with a small area overlapping the Grassland Natural Region. Each study area covers 5,000–6,000 km² and encompasses numerous open waterbodies, including lakes, ponds, reservoirs, dugouts, and wetlands.
- Using open-access satellite imagery and machine learning classification, open water presence was identified monthly during the 2020–2023 growing seasons (May–October).
- The percentage of time a 10-meter by 10-meter area was identified as open water was calculated. The frequency that each area is detected as open water is summarized by:
- Overall average of the whole study period
- Seasons, including spring, summer, and fall
- Years of the study, 2020-2023
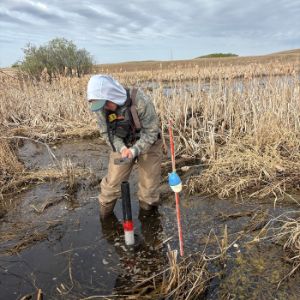
- Results were validated using ABMI field data, a Ducks Unlimited Canada photo-interpreted dataset, and a manually interpreted high-resolution imagery.
The HydroPatterns dataset includes:
- Monthly open water maps from May to October for each year
- Annual open water frequency maps
- Seasonal open water frequency maps (spring, summer, and fall)
- A multi-year average open water frequency map
HydroPatterns study areas in Alberta. Two study areas were selected to map open water patterns: the boreal study area is in the Boreal Forest Natural Region and the prairie study area is mainly in the Parkland Natural Region with a small area overlapping the Grassland Natural Region.
Results
The following section summarizes results from the HydroPatterns project, describing how open water area varies across the study areas, seasons, and years.
Highlights
- HydroPatterns consistently detected open water with over 90% accuracy, across both study areas.
- In both study areas, permanent lakes had stable water levels, with open water present 80% of the time. Non-permanent lakes varied more with open water present 65% of the time.
- HydroPatterns outperformed existing open water identification products (see Delancey et al. 2018[3] and Olthof and Rainville 2022[10]) in detecting small waterbodies, outlining edges more clearly, and identifying greater numbers of non-permanent waterbodies that appear and disappear monthly.
Results and maps for each study area are presented below.
Boreal Study Area
- In the boreal study area, open water area remained stable through the seasons and among years.
- Non-permanent water accounted for 6.0% of the landscape over the period 2020-2023.
- Overall, permanent lakes had stable water levels with open water present 80% of the time, whereas non-permanent lakes were more variable with open water present 65% of the time.
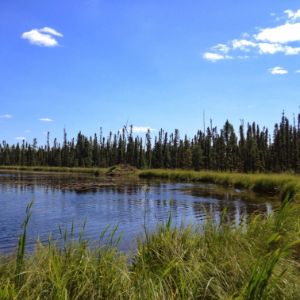
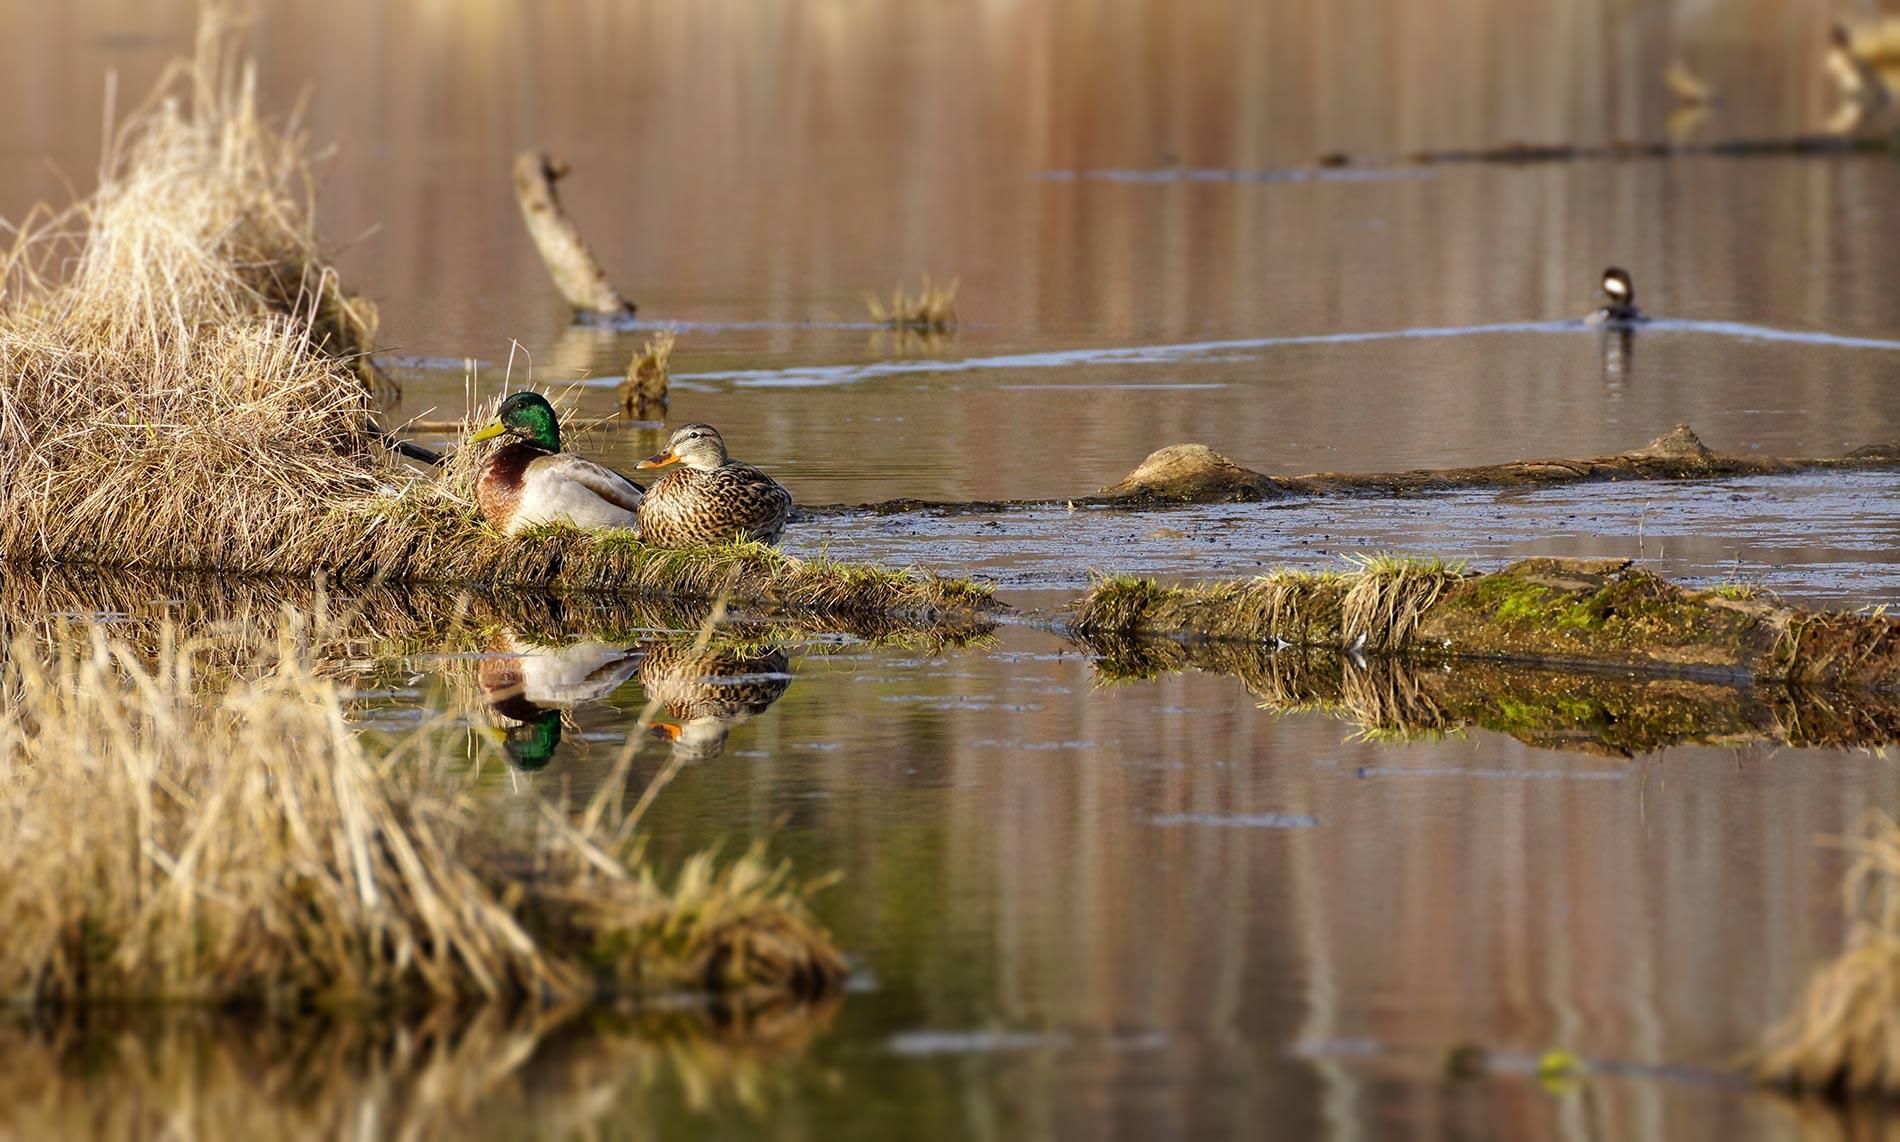
Wetlands in the boreal forest generally have stable hydroperiods, with consistent open water presence.
Total open water area. Variation of monthly open water area in hectares in the boreal forest study area, during the growing season (May - October) from 2020-2023. Hover over each point to view the area of open water each month and year.
 Varina Crisfield
Boreal Study Area Open Water Maps
The following maps show the patterns of open water presence over time in the boreal study area, summarizing the frequency that open water is identified by:
- Overall 4-year average
- By season (spring, summer, and fall)
- By year (2020-2023)
Click on a tab to view each open water map.
Open water frequency in the boreal study area. The map shows the percentage of time each 10 m × 10 m area was identified as open water between 2020 and 2023, summarized for the full period, by month, and by year. Lighter blue indicates that area is less frequently identified as open water, whereas darker blue shows an area is frequently covered in open water.
Seasonal open water frequency in the boreal study area. The map shows the percentage of time each 10 m × 10 m area was identified as open water during spring, summer, and fall, averaged across the 2020–2023 study period. Lighter blue indicates areas where open water occurred less frequently, while darker blue shows areas where open water was present more often. Use the “show as animation” button or select seasons in the legend to compare open water patterns from spring through fall.
Annual open water frequency in the boreal study area. The map shows the percentage of time each 10 m × 10 m area was identified as open water in each year of the study period (2020–2023). Lighter blue indicates areas where open water occurred less frequently, while darker blue shows areas where open water was present more often. Use the “show as animation” button or select years in the legend to compare open water patterns across the four study years.
Prairie Study Area
- In the prairie study area, open water area was highest in the spring, and decreased through the summer, with lowest levels in the fall.
- Open water area also decreased from year to year, with the highest area in 2020 and the lowest area in 2023.
- Non-permanent water accounted for 6.5% of the landscape from 2020-2023.
- Overall, permanent lakes had stable water levels and open water present 80% of the time, whereas non-permanent lakes were more variable with open water present 65% of the time.
 Kirstan Tereschyn
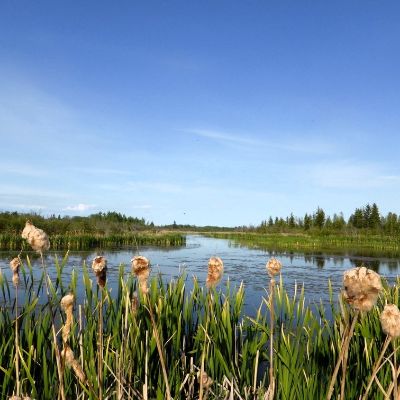
Prairie wetlands often have limited groundwater input, making their hydroperiods more variable in response to precipitation and evaporation.
Total open water area. Variation of monthly open water area in hectares in the prairie study area, during the growing season (May - October) from 2020-2023. Hover over each point to view the area of open water each month and year.
_Hinchliffe-1.jpg) Rob Hinchliffe
Rob Hinchliffe
Prairie Study Area Open Water Maps
The following maps show the patterns of open water presence over time in the prairie study area, summarizing the frequency that open water is identified by:
- Overall 4-year average
- By season (spring, summer, and fall)
- By year (2020-2023)
Click on a tab to view each open water map.
Open water frequency in the prairie study area. The map shows the percentage of time each 10 m × 10 m area was identified as open water between 2020 and 2023, summarized for the full period, by month, and by year. Lighter blue indicates that area is less frequently identified as open water, whereas darker blue shows an area is frequently covered in open water.
Seasonal open water frequency in the prairie study area. The map shows the percentage of time each 10 m × 10 m area was identified as open water during spring, summer, and fall, averaged across the 2020–2023 study period. Lighter blue indicates areas where open water occurred less frequently, while darker blue shows areas where open water was present more often. Use the “show as animation” button or select seasons in the legend to compare open water patterns from spring through fall.
Annual open water frequency in the prairie study area. The map shows the percentage of time each 10 m × 10 m area was identified as open water in each year of the study period (2020–2023). Lighter blue indicates areas where open water occurred less frequently, while darker blue shows areas where open water was present more often. Use the “show as animation” button or select years in the legend to compare open water patterns across the four study years.
Future Direction
HydroPatterns provides a consistent, repeatable way to describe where open surface water occurs in Alberta and how it changes over time.
- By focusing on hydroperiod, the project improves detection of temporal shifts in water availability that are relevant to biodiversity conservation, water management, and land-use planning.
- The HydroPatterns workflow can be scaled to province-wide coverage and updated regularly.
- Future enhancements include expanding training datasets, adapting methods for the Rocky Mountain Natural Region, incorporating water-level observations for validation, exploring longer-wavelength radar data to improve detection of inundated vegetation, and enhancing model transparency through Explainable Artificial Intelligence.
 Jenet Dooley
References
Thorp, J.H., A.P. Covich. 2015. Overview of Inland Water Habitats. In Thorp and Covich’s Freshwater Invertebrates, Boston: Academic Press, 23–56. Available at: https://linkinghub.elsevier.com/retrieve/pii/B9780123850263000024.
Amani, M., B. Brisco, R. Warren, E.R. DeLancey, S.T. Seydi, V. Poncos. 2022. Wetland Hydroperiod Analysis in Alberta Using InSAR Coherence Data. Remote Sensing 14: 3469. Available at: https://www.mdpi.com/2072-4292/14/14/3469.
DeLancey, E.R., J. Kariyeva, J. Cranston, B. Brisco. 2018. Monitoring Hydro Temporal Variability in Alberta, Canada with Multi-Temporal Sentinel-1 SAR Data. Canadian Journal of Remote Sensing 44(1): 1–10. Available at: https://www.tandfonline.com/doi/full/10.1080/07038992.2018.1417734.
Daniel, J., J.E. Gleason, K. Cottenie, R.C. Rooney. 2019. Stochastic and Deterministic Processes Drive Wetland Community Assembly across a Gradient of Environmental Filtering. Oikos 128: 1158–69. Available at: https://nsojournals.onlinelibrary.wiley.com/doi/10.1111/oik.05987.
Daniel, J., R.C. Rooney. 2024. Consistent but Delayed Timing of Precipitation Affects Community Composition of Prairie Pothole Birds and Aquatic Macroinvertebrates, but Not Wetland Plants. Wetlands 44: 17. Available at: https://link.springer.com/10.1007/s13157-024-01774-y.
Frost, L.K., S.J. Mika, R.M. Thompson, I. Growns. 2024. Influence of Hydroperiod on Aquatic Food-Web Structure and Energy Production in a Floodplain Wetland: Implications for Environmental Flow Management. Marine and Freshwater Research 75: MF23163. Available at: https://connectsci.au/mf/article/75/1/MF23163/61131/Influence-of-hydroperiod-on-aquatic-food-web.
Hockaday, A.C., A.S. Leon, K. Patterson, S.C. Pennings. 2024. Freshwater Wetlands for Flood Control: How Manipulating the Hydroperiod Affects Plant and Invertebrate Communities. PLOS ONE 19(7): e0306578. Available at: https://dx.plos.org/10.1371/journal.pone.0306578.
Winikoff, S.G., J.C. Finlay. 2023. Water-Quality Outcomes of Wetland Restoration Depend on Hydroperiod Rather than Restoration Strategy. Freshwater Science 42(1): 70–87. Available at: https://www.journals.uchicago.edu/doi/10.1086/724014.
Erwin, K.L. 2009. Wetlands and Global Climate Change: The Role of Wetland Restoration in a Changing World. Wetlands Ecology and Management 17(1): 71–84. Available at: http://link.springer.com/10.1007/s11273-008-9119-1.
Olthof, I., T. Rainville. 2022. Dynamic Surface Water Maps of Canada from 1984 to 2019 Landsat Satellite Imagery. Remote Sensing of Environment 279: 113121. Available at: https://linkinghub.elsevier.com/retrieve/pii/S0034425722002358.
Contributors

Thuy Doan, Geospatial Data Scientist, Alberta Biodiversity Monitoring Institute (ABMI)
Since April 2023, Thuy has been a member of the Earth Observation Insight team, contributing to the development of satellite-based products for habitat mapping and monitoring across Alberta.
If you have questions about HydroPatterns, please get in touch: thuy.doan@ualberta.ca.

Jennifer Hird, Earth Observation Insights Lead Scientist, Alberta Biodiversity Monitoring Institute (ABMI)
Jen has supported geospatial research and development within the ABMI for over 10 years. In her current role, she leads the organization's satellite-based mapping and monitoring efforts.
If you have questions about HydroPatterns, please get in touch: jennifer.hird@ualberta.ca.
We are grateful for the support of the ABMI's delivery partners.

We would like to acknowledge the organizations and sponsors highlighted below who financially supported the development of this report.